

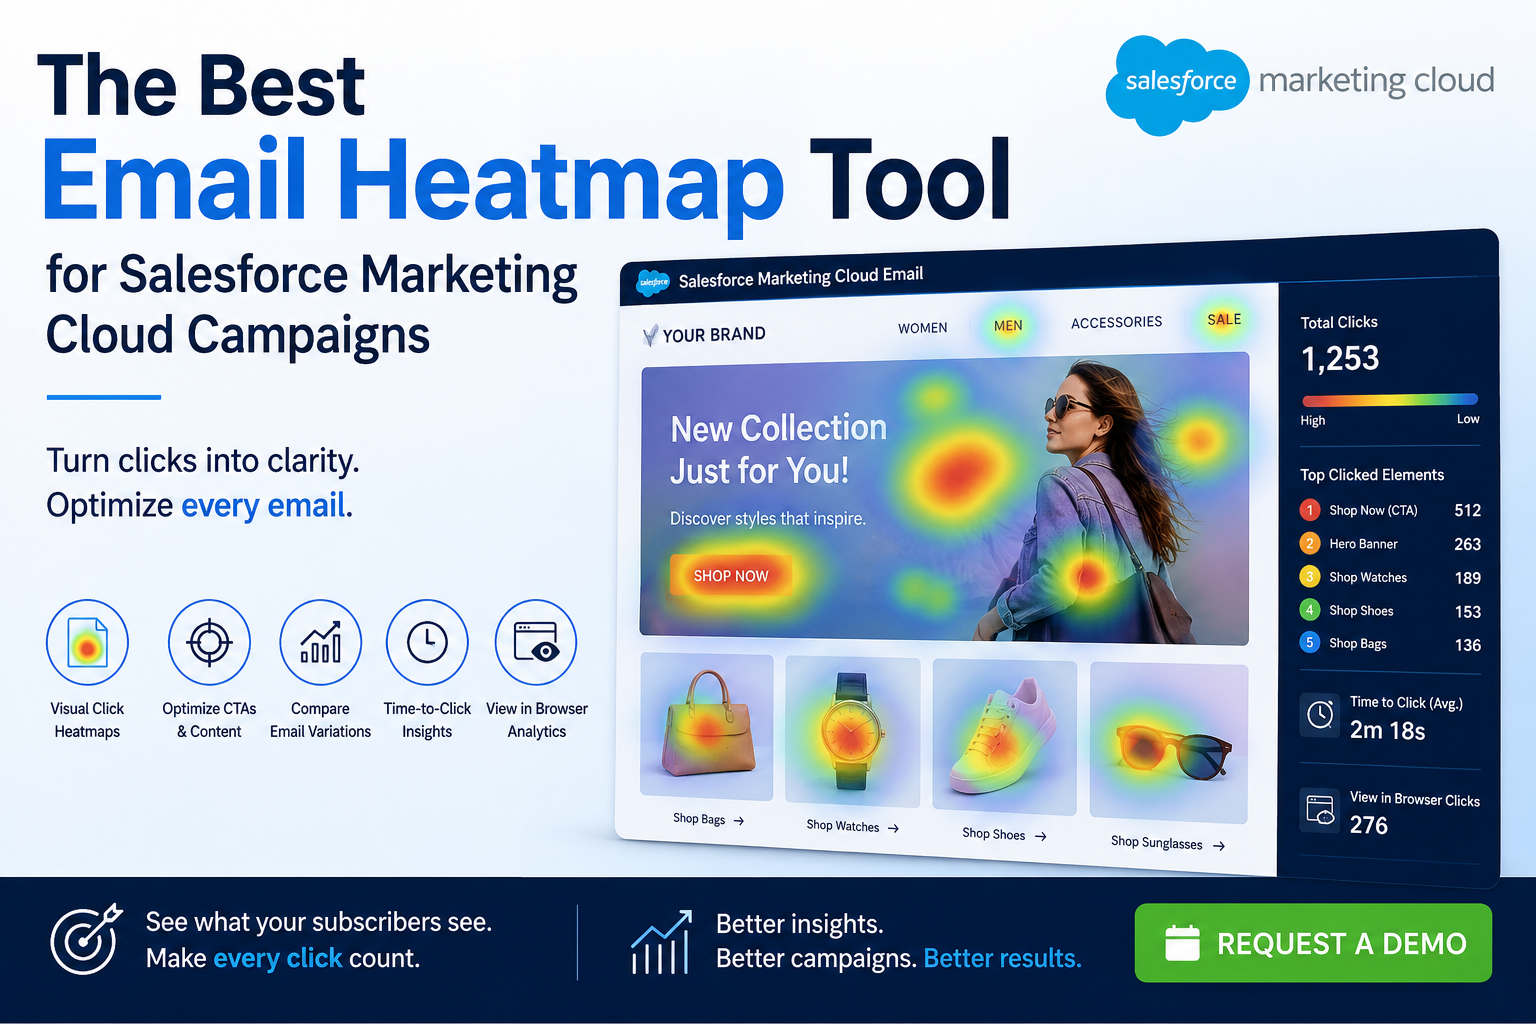

The Best Email Heatmap Tool for Salesforce Marketing Cloud Campaigns
Salesforce Marketing Cloud gives campaign teams access to important performance metrics, including sends, opens, clicks, click-through rates, bounces and unsubscribes.
These metrics tell you whether engagement happened. However, they do not always make it easy to understand how subscribers interacted with the design of the email.
Which image attracted the most clicks? Did subscribers select the main call to action or a secondary text link? Did a product block near the bottom generate any interest? Did one personalised email version perform differently from another?
The best email heatmap tool for Salesforce Marketing Cloud should answer these questions visually, quickly and clearly.
Instead of forcing marketers to analyse long lists of URLs, an email heatmap places click activity directly over the original email design. Campaign managers can immediately see which sections attracted attention, which calls to action performed well and which content subscribers ignored.
Why SFMC Teams Need More Than Click Reports
Salesforce Marketing Cloud click reporting remains an essential part of campaign measurement. It helps teams understand how many clicks occurred and which links were selected.
The challenge is connecting those numbers to the email creative.
A standard report might show that one URL received 900 clicks while another received 120. But marketers may still need to open the email, locate both links and determine whether they were buttons, images, navigation items or text links.
This creates several problems:
Campaign analysis takes longer.
Designers receive limited visual feedback.
Stakeholders struggle to interpret technical reports.
Poorly performing content can remain unnoticed.
Teams make optimisation decisions based on assumptions.
An email heatmap solves this problem by turning click data into a visual engagement map.
What Should the Best SFMC Email Heatmap Tool Provide?
Not every heatmap platform is designed for Salesforce Marketing Cloud. General website heatmap tools may analyse webpage interactions, but email campaigns require different tracking, reporting and personalisation capabilities.
When evaluating an SFMC email heatmap solution, look for the following features.
1. Visual Click Overlays
The tool should display click activity directly over the email design.
High-performing areas should be easy to identify through clear visual indicators. This allows teams to understand whether subscribers clicked:
Hero images
Primary CTA buttons
Product cards
Navigation links
Supporting text links
Footer content
This visual context is what transforms ordinary click data into actionable campaign intelligence.
2. Individual Link and CTA Performance
A campaign can generate a healthy overall click-through rate even when the primary CTA performs poorly.
Subscribers may be clicking the logo, hero image, navigation menu, social icons or secondary links instead of the intended conversion button.
The best email heatmap tool should show the performance of every linked element and help teams rank CTAs by engagement.
This allows marketers to determine whether the main CTA actually controlled attention or quietly lost clicks to competing elements.
3. Dynamic and Personalised Email Tracking
Salesforce Marketing Cloud campaigns often contain dynamic content based on language, location, customer segment, product interest or lifecycle stage.
Combining every personalised variation into one report can hide important differences.
For example, a hero image may perform well for UK subscribers but poorly for another market. One language version may generate strong CTA engagement while another version produces clicks mainly on supporting content.
A capable SFMC heatmap platform should capture and analyse each dynamic email version separately.
Teams should be able to compare performance by:
Country
City
Language
Audience segment
Content variation
Personalised image
Dynamic headline
Dynamic CTA
CRMx can analyse personalised email versions independently and compare multiple campaign variations rather than combining every version into one aggregated view.
4. Click Order and Time-to-Click Intelligence
Knowing what subscribers clicked is valuable. Knowing when they clicked and which link they selected first provides even deeper insight.
Click-order reporting can reveal the path subscribers followed through the email.
Time-to-click analysis can show whether a campaign generated immediate action or whether engagement developed gradually after delivery.
These insights help campaign teams evaluate:
The effectiveness of urgency messaging
Which element attracts the first interaction
Whether secondary links distract from the main CTA
How quickly subscriber interest declines
Whether the email structure guides users correctly
This turns a heatmap from a simple visual report into a more complete behavioural analysis tool.
5. Email Variation Comparison
A/B testing should explain more than which version achieved the highest overall click-through rate.
The best email heatmap solution should show why one variation performed better.
Teams should be able to compare how engagement changed when they modified:
Hero images
CTA wording
Button placement
Product order
Email length
Navigation structure
Personalised content
Promotional messaging
CRMx supports comparisons across multiple campaign versions, including more complex personalised and multivariate email programmes.
6. View in Browser Analytics
Subscriber behaviour does not always remain inside the inbox.
Some recipients select the View in Browser link and continue interacting with the browser-rendered version of the email. Standard email reporting may provide limited visibility into what happens after that transition.
CRMx View in Browser analytics can extend the analysis to browser-rendered emails, including clicks, mouse movement, scrolling and session activity.
This helps teams understand the journey from:
Email engagement → View in Browser → Website interaction
Instead of losing visibility when subscribers leave the original email, marketers can gain a more connected view of the customer experience.
7. Reports That Stakeholders Can Understand
Campaign reporting is often shared with CRM managers, designers, senior leaders, agencies and regional marketing teams.
Not every stakeholder wants to study URL tables or technical tracking exports.
Visual heatmaps make campaign results easier to understand. They allow teams to see the strongest and weakest sections of an email without requiring a detailed explanation of the underlying data.
This supports faster reviews, clearer design feedback and stronger optimisation decisions.
Why CRMx Is Built for Salesforce Marketing Cloud Teams
CRMx is designed to add visual and behavioural intelligence to Salesforce Marketing Cloud campaigns.
It helps teams:
Display clicks directly over the email creative
Identify high- and low-performing content
Rank links and CTAs by engagement
Analyse click order and time-to-click behaviour
Separate dynamic and personalised email versions
Compare multiple campaign variations
Analyse View in Browser interactions
Continue visibility into supported CloudPages and websites
Share understandable visual reports with stakeholders
CRMx does not replace Salesforce Marketing Cloud reporting. It adds the visual context that campaign teams need to understand why an email performed the way it did.
Turn SFMC Click Data Into Better Campaign Decisions
The best email heatmap tool should do more than produce an attractive colour overlay.
It should help your team identify distractions, improve CTA hierarchy, compare personalised content, optimise layouts and explain campaign performance to stakeholders.
Every Salesforce Marketing Cloud campaign generates valuable engagement data. CRMx helps transform that data into visual evidence your team can use to improve the next send.
Explore the complete CRMx Email Heatmap features and benefits.
Ready to see how subscribers interact with your own Salesforce Marketing Cloud emails?
Request a personalised CRMx Email Heatmap demo and discover what your standard click reports are not showing.