

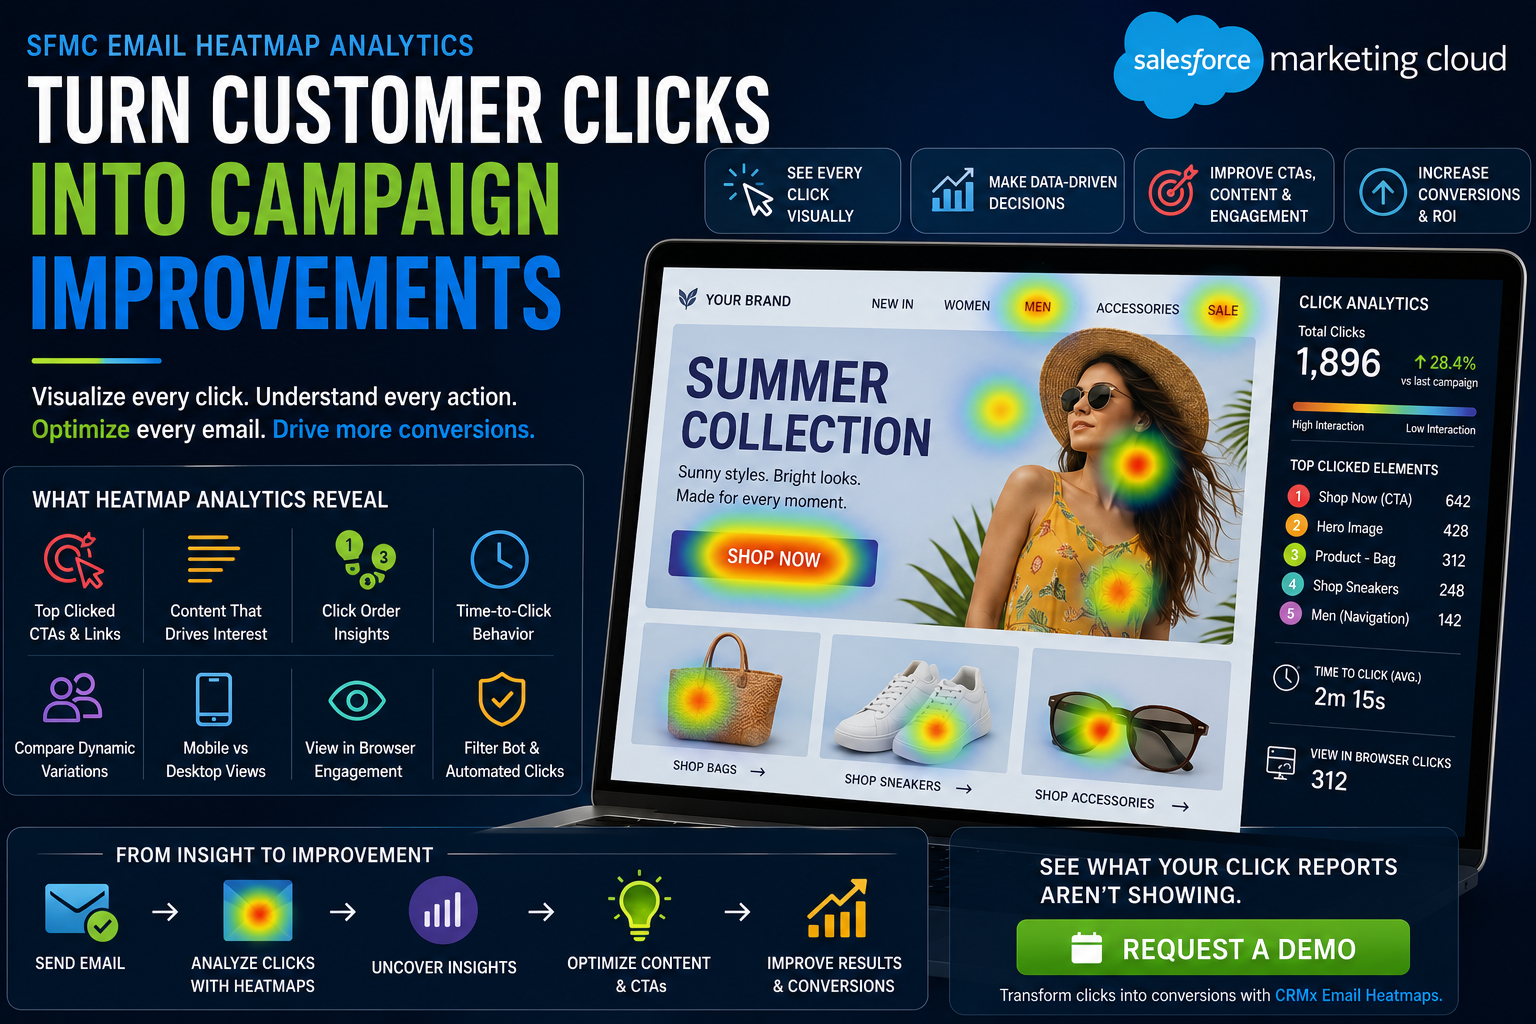

SFMC Email Heatmap Analytics: Turn Customer Clicks into Campaign Improvements
Every Salesforce Marketing Cloud campaign generates valuable customer engagement data.
Subscribers click hero images, CTA buttons, product cards, navigation links and supporting content. These interactions provide clues about customer interests and campaign effectiveness.
However, click totals alone do not always explain what should be improved.
A campaign report may show that an email generated 2,000 clicks. But did the primary CTA attract the most attention? Did subscribers engage with the hero image instead of the button? Were clicks concentrated near the top of the email? Did one dynamic content variation outperform another?
SFMC email heatmap analytics connect customer click data with the email creative, helping marketing teams turn engagement into clear campaign improvements.
Instead of analysing URLs in isolation, teams can see where subscribers interacted and use that visual evidence to optimise future campaigns.
What Are SFMC Email Heatmap Analytics?
An SFMC email heatmap displays click activity directly over a Salesforce Marketing Cloud email.
High-engagement areas are visually highlighted, making it easier to identify the links, images and CTAs that attracted the most attention.
Rather than reviewing click data separately from the email design, marketers can understand engagement in its original creative context.
A heatmap can help answer questions such as:
Which CTA received the most clicks?
Did customers click the hero image or the button?
Which products attracted the strongest interest?
Did subscribers engage with lower sections of the email?
Were navigation links distracting from the primary goal?
Which personalised content variation performed best?
How quickly did customers interact after delivery?
These insights make campaign analysis more practical and easier to communicate to designers, marketers and senior stakeholders.
Why Standard Click Totals Are Not Enough
Total clicks are an important performance metric, but they can hide significant differences in subscriber behaviour.
Imagine two Salesforce Marketing Cloud emails that each generate 1,000 clicks.
In the first email, 700 clicks come from the primary “Shop Now” CTA.
In the second email, clicks are spread across the logo, navigation menu, social media icons, product images and footer links.
Both campaigns generated the same total number of clicks, but the first email created a much clearer conversion path.
SFMC email heatmap analytics reveal this difference visually.
They help teams distinguish between general email interaction and clicks that support the campaign’s main business objective.
Identify the Content Customers Care About
Customer clicks provide direct evidence of content interest.
An email may contain several products, services, offers or content blocks. A heatmap can show which elements attracted attention and which were ignored.
For example, a retail campaign may feature handbags, footwear, accessories and beauty products. The heatmap may reveal that footwear received most of the engagement, even though it appeared halfway down the message.
The marketing team can use this insight to:
Move the high-interest category higher in future emails
Build a follow-up campaign around that category
Personalise future recommendations
Feature the product in the subject line or preheader
Give the category more visual prominence
Create a dedicated landing page or journey
Heatmaps turn individual clicks into evidence that can influence campaign planning and content strategy.
Improve Primary CTA Performance
The primary call to action should guide subscribers towards the campaign’s main conversion goal.
That goal might be:
Buying a product
Booking an appointment
Registering for an event
Downloading content
Visiting a store
Activating an account
Requesting a demonstration
A heatmap can reveal whether the primary CTA successfully attracted attention.
If subscribers are clicking the hero image but ignoring the button, the CTA may need stronger wording, better placement or improved contrast.
If navigation links receive more clicks than the main CTA, the email may contain too many competing actions.
Marketers can use these findings to test:
More direct CTA wording
Larger buttons
Higher CTA placement
Fewer secondary links
More whitespace around the button
A stronger visual hierarchy
Better alignment between the headline and CTA
These changes can make the conversion journey clearer and reduce unnecessary distractions.
Compare Buttons, Images and Text Links
Several elements inside an email may direct customers to the same destination.
A hero image, CTA button and text link could all lead to one landing page.
When reporting focuses only on the destination URL, it may be difficult to understand which creative element generated the interaction.
SFMC email heatmap analytics make it easier to compare each element in context.
Teams can determine whether customers prefer clicking:
Buttons
Product images
Hero banners
Headlines
Supporting text
Navigation items
This information can help designers create emails that reflect actual subscriber behaviour rather than internal assumptions.
Meaningful link names, titles and aliases also make each interaction easier to identify and analyse.
Understand Click Order
The sequence of customer interactions can provide valuable behavioural context.
The first link selected often shows which element captured attention most quickly.
Click-order analytics can reveal:
Which CTA received the first interaction
Whether subscribers followed the intended content journey
Whether customers skipped the hero section
Which product attracted immediate interest
Whether a secondary link distracted from the primary CTA
For example, if subscribers repeatedly click a product image before reading the main promotional message, the visual product content may be doing more work than the campaign copy.
If customers consistently select the navigation menu first, the email may not be focused enough.
CRMx Email Heatmaps can help teams review click order alongside the email creative, making these interaction patterns easier to understand.
Measure Time to Click
Time-to-click analytics show how quickly customers act after receiving an email.
Fast engagement may indicate strong interest, urgency or relevance. Slower engagement may show that subscribers returned later or required more time before deciding.
This insight is useful for:
Limited-time offers
Abandoned basket emails
Event registrations
Product launches
Appointment reminders
Promotional campaigns
B2B lead-generation emails
Time-to-click behaviour can also support follow-up strategy.
Customers who click quickly but do not convert may be suitable for a reminder, retargeting campaign or sales follow-up.
The timing of engagement helps teams understand not only what customers clicked, but when intent was strongest.
Compare Dynamic and Personalised Email Variations
Salesforce Marketing Cloud is frequently used to deliver personalised content.
Different subscribers may receive different:
Images
Headlines
Product recommendations
Offers
Languages
CTA labels
CTA destinations
Content blocks
When every variation is combined into one report, teams may struggle to identify which personalised version performed best.
CRMx can help separate dynamic email versions and compare engagement by criteria such as:
Country
City
Language
Customer segment
Product affinity
Dynamic headline
Dynamic image
Personalised CTA
This helps marketers identify successful personalisation strategies and improve weaker variations.
Instead of assuming that every version performs equally, teams can make decisions based on actual customer behaviour.
Improve A/B Testing Decisions
A/B testing can reveal which email version generated the strongest overall result.
Heatmaps help explain why one version performed better.
Marketing teams can compare how subscribers responded to different:
Hero images
Button positions
CTA wording
Email lengths
Navigation structures
Product arrangements
Promotional messages
Content layouts
For example, Version B may generate a higher click-through rate because the primary CTA was placed above the fold. Alternatively, it may have performed better because one product image attracted most of the engagement.
Heatmaps provide the visual context needed to understand the result and apply the learning to future campaigns.
Analyse View in Browser Engagement
Some subscribers open the browser-rendered version of an email through the View in Browser link.
The initial click may appear in the email report, but customer interaction can continue after the browser page opens.
CRMx View in Browser analytics can extend visibility into supported browser activity, including:
Page clicks
CTA interactions
Scroll behaviour
Mouse movement
Device information
Platform information
Session activity
This helps marketing teams understand the customer journey from the inbox to the browser-rendered email and then to the website.
It also prevents valuable engagement insight from being lost when subscribers leave the original email.
Build a Campaign Improvement Process
The greatest value of SFMC email heatmap analytics comes from turning insights into action.
After each campaign, document:
The most-clicked element
The highest-performing conversion CTA
The first link commonly selected
The strongest content block
The least-engaged section
The best-performing dynamic variation
The average time to click
One improvement for the next campaign
This creates a repeatable optimisation process.
Over time, teams can build a library of engagement insights covering CTA placement, content preferences, email length, product order and personalisation.
Campaign decisions then become evidence-based rather than subjective.
Turn Customer Clicks into Better Campaigns with CRMx
CRMx adds visual and behavioural intelligence to Salesforce Marketing Cloud campaign reporting.
Marketing teams can use CRMx to:
View customer clicks directly over email creatives
Identify high-, medium- and low-engagement areas
Compare buttons, images and text links
Analyse total and unique clicks
Understand click order
Measure time-to-click behaviour
Compare dynamic and personalised versions
Review supported View in Browser activity
Share clear visual insights with stakeholders
Make evidence-based campaign improvements
Standard click reports show that engagement happened.
CRMx helps teams understand where it happened, why certain content attracted attention and how the next Salesforce Marketing Cloud campaign can perform better.
Explore the CRMx Email Heatmap features and benefits to see how visual email intelligence can strengthen your campaign strategy.
Ready to turn customer clicks into measurable campaign improvements?
Request a personalised CRMx demonstration and discover what your Salesforce Marketing Cloud email data can reveal.