

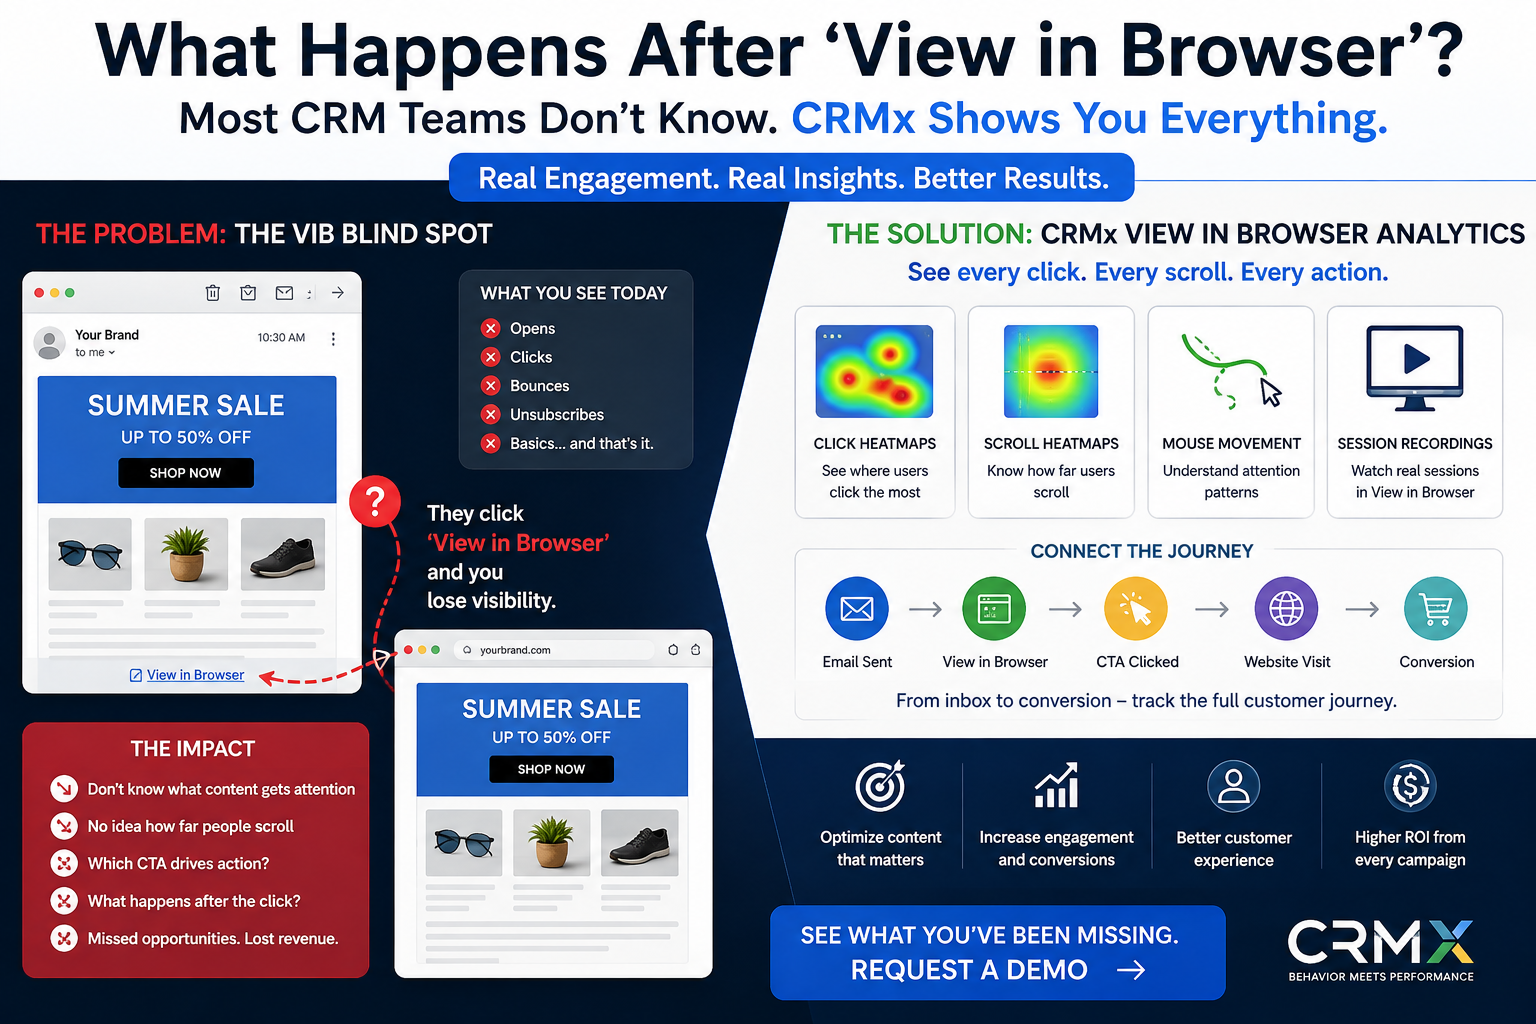

Salesforce Marketing Cloud View in Browser Analytics: The Reporting Gap Most CRM Teams Cannot See
Salesforce Marketing Cloud gives CRM teams powerful tools to create, personalise, send and measure email campaigns.
You can analyse deliveries, opens, clicks, bounces, unsubscribes and campaign performance.
But there is an important part of the customer journey that many teams rarely analyse:
What happens after a recipient clicks “View in Browser”?
The email leaves the inbox and opens as a browser-rendered experience.
At that point, marketers may have far less behavioural visibility into what the customer actually does.
Did they scroll?
Which CTA attracted their attention?
Did they interact differently with the browser version?
Did they click through to the website?
Did they struggle with the experience before leaving?
For many CRM teams, this creates a significant View in Browser analytics gap.
CRMx is designed to help close that gap.
"Request a personalised CRMx demo" (https://crmx.uk/request-demo)
What Is View in Browser in Salesforce Marketing Cloud?
Salesforce Marketing Cloud emails commonly provide recipients with a View in Browser option.
A customer may select it because:
- Their email is not rendering correctly
- Images are blocked by the email client
- They prefer reading the message in a browser
- They want a larger or clearer version of the email
- Their inbox has altered the original design
- They want to reopen or share the browser-rendered experience
From the customer's perspective, this is simply another way to experience the campaign.
From an analytics perspective, however, something important has happened:
The customer has moved from the inbox into a browser environment.
That transition deserves its own behavioural intelligence.
The Hidden View in Browser Reporting Gap
Imagine an SFMC campaign generates:
- 500,000 delivered emails
- 120,000 opens
- 8,000 clicks
- 2,000 View in Browser visits
Traditional campaign reporting can tell you a great deal about the email.
But consider those 2,000 browser visitors.
You may still want to know:
- Which parts of the browser-rendered email attracted attention?
- Which CTA did people interact with first?
- How far did they scroll?
- Which content was ignored?
- Did desktop visitors behave differently from mobile visitors?
- How long did visitors engage with the experience?
- What happened immediately before they left?
- Where did they go after clicking a website CTA?
Without that behavioural layer, a potentially valuable part of the customer journey remains difficult to understand.
Why This Matters More Than Most CRM Teams Realise
A View in Browser click is not necessarily the end of email engagement.
It can be the beginning of another digital interaction.
The journey may look like:
SFMC Email → View in Browser → CTA → Website → Product or Service Page → Conversion
Yet organisations often analyse these stages through separate reports.
The email team looks at SFMC.
The digital team looks at website analytics.
The optimisation team may review heatmaps or session recordings.
The result is fragmented visibility.
CRMx approaches the journey differently by helping marketing teams understand behavioural engagement across connected campaign touchpoints.
Standard Email Metrics Tell You What Happened
Traditional email reporting remains essential.
Metrics such as:
- Delivered
- Opens
- Clicks
- CTR
- CTOR
- Bounces
- Unsubscribes
tell campaign teams whether recipients interacted with an email.
But imagine this result:
Email A
- Open rate: 32%
- CTR: 4.8%
Email B
- Open rate: 31%
- CTR: 4.6%
The performance looks similar.
Now imagine Email B generates significantly more View in Browser activity.
Without analysing that browser experience, you may miss an important behavioural difference between the campaigns.
The question changes from:
“How many people clicked?”
to:
“How did customers actually experience the campaign?”
That is the difference between campaign reporting and behavioural intelligence.
What CRMx View in Browser Analytics Adds
CRMx VIB Suite is designed to provide additional visibility into compatible View in Browser experiences.
Instead of treating the browser version as an analytics blind spot, CRM teams can investigate how customers interact with it.
1. View in Browser Click Heatmaps
A click heatmap visually shows where recipients interact with the browser-rendered email.
Rather than reviewing only a list of links and click totals, campaign teams can see engagement directly against the creative.
This can help answer questions such as:
- Is the hero CTA attracting engagement?
- Are customers clicking product images instead of buttons?
- Are secondary CTAs distracting from the primary goal?
- Is navigation receiving more attention than campaign content?
- Which sections generate little or no interaction?
Visual reporting makes these patterns much easier to identify.
2. Mouse-Movement Heatmaps
Clicks represent an action.
Mouse movement can provide additional behavioural context.
On supported desktop experiences, movement patterns may help teams investigate which areas of the browser-rendered email attract interaction before a click occurs.
This can help identify:
- Areas receiving attention
- Content that attracts exploration
- Sections users move across without clicking
- Differences between apparent attention and actual conversion
The objective is not simply to collect more data.
The objective is to understand why particular elements perform differently.
---
3. Scroll-Depth Heatmaps
One of the biggest questions in long campaign designs is:
Did customers actually reach the content we wanted them to see?
Imagine your most valuable offer sits near the bottom of the browser-rendered email.
The CTA records relatively few clicks.
You might conclude:
«“The offer is not interesting.”»
But what if most visitors never scrolled far enough to see it?
That is a completely different problem.
Scroll analysis helps distinguish between:
People saw the offer and did not engage
and
People never reached the offer in the first place
Those two problems require very different optimisation decisions.
---
View in Browser Session Recordings
Heatmaps reveal aggregated behavioural patterns.
Session recordings provide another perspective.
CRMx can record supported View in Browser sessions so teams can replay interactions and investigate how individual visitors navigated the browser-rendered campaign.
A session may reveal behaviour such as:
- Scrolling down and returning to earlier content
- Hesitation around a CTA
- Repeated interaction with particular elements
- Rapidly skipping sections
- Leaving before reaching important content
- Continuing from the VIB page to the website
This can be particularly useful when a campaign's performance data tells you something is wrong but not why.
---
A Practical Example
Imagine a retailer sends an SFMC promotional email containing:
1. Hero promotion
2. Women's category
3. Men's category
4. Children's category
5. Loyalty offer
6. Main “Shop Now” CTA
Standard reporting shows that the campaign generated reasonable clicks.
However, the marketing team wants to understand why the loyalty offer underperformed.
Without behavioural information, the conclusion might be:
«Customers were not interested in the loyalty proposition.»
Now imagine the View in Browser scroll heatmap shows that only a relatively small proportion of visitors reached that section.
The problem may not be the offer.
The problem may be content placement.
The team can test moving the loyalty proposition higher in the next campaign.
This is the value of behavioural intelligence:
It turns a performance symptom into an optimisation hypothesis.
---
VIB Analytics Can Reveal Content That Customers Ignore
CRM teams spend considerable time producing:
- Hero imagery
- Promotional modules
- Product recommendations
- Dynamic content
- Personalised offers
- Navigation
- Secondary CTAs
- Legal and supporting content
But every additional block increases the length and complexity of the campaign.
Without behavioural visibility, teams may repeatedly include content that contributes very little to customer engagement.
VIB heatmaps can help identify:
- Engagement hotspots
- Low-engagement sections
- Scroll drop-off
- CTA concentration
- Content competing for attention
- Potential layout friction
Instead of asking:
«“Does the design look good?”»
teams can ask:
«“How are customers actually using it?”»
---
Dynamic and Personalised Emails Make the Problem Even Harder
Salesforce Marketing Cloud is frequently used for sophisticated personalisation.
A single campaign might show different:
- Products
- Images
- Offers
- Languages
- Locations
- CTAs
- Content blocks
depending on the recipient.
This can make aggregated campaign reporting difficult to interpret.
Suppose:
Version A is shown to customers in London.
Version B is shown to customers in Manchester.
Version C is shown to customers in Edinburgh.
Overall campaign metrics may look healthy.
But one version could be performing considerably better than another.
CRMx can support separate analysis of appropriately configured personalised variations, allowing marketing teams to investigate the behaviour generated by different campaign experiences rather than relying only on combined totals.
---
Compare View in Browser Variants Visually
A/B testing often tells marketers which version produced the better numerical result.
But the next question should be:
Why?
Consider two versions:
Version A
Hero image → headline → CTA
Version B
Headline → offer → product image → CTA
Version B produces more clicks.
Traditional reporting can identify the winning version.
Behavioural analysis can help investigate why.
Perhaps:
- Version B's CTA appeared earlier
- More visitors reached the offer
- Version A's image distracted users
- Version B created a clearer visual path
- Engagement was distributed differently across the page
The result becomes more useful because the team learns something that can influence future campaigns.
---
Email → VIB → Website: Follow the Journey Further
View in Browser should not be analysed as an isolated destination.
The recipient may continue into the website.
For example:
Email received
↓
View in Browser selected
↓
Browser-rendered email viewed
↓
Product CTA clicked
↓
Website visited
↓
Product information reviewed
↓
Conversion or abandonment
CRMx is designed to help connect supported email, VIB and website behavioural analysis into a broader customer-journey view.
"Explore CRMx Features & Benefits" (https://crmx.uk/features-benefits)
---
Website Heatmaps Continue the Story
Suppose customers interact strongly with a CTA on the View in Browser page.
That sounds positive.
But website conversion remains poor.
The problem may no longer be the email.
It may be the landing experience.
Website heatmaps can help investigate:
- Which elements visitors click
- How far visitors scroll
- Which sections attract interaction
- Where engagement decreases
- Whether important content is being reached
- Whether users are interacting with unexpected elements
This allows teams to investigate performance beyond the initial email click.
---
Website Session Recordings Add Individual Context
Imagine the VIB campaign successfully drives users to a product page, but conversions remain lower than expected.
A website session recording might reveal:
- Visitors repeatedly scrolling between sections
- Important information positioned too low
- A confusing CTA
- Navigation pulling people away from the intended journey
- Mobile visitors struggling with the experience
- Users abandoning before reaching the conversion point
The email campaign may have done its job perfectly.
The conversion barrier may exist somewhere else in the journey.
That distinction matters.
---
Why Connected Journey Intelligence Matters to Marketing Leaders
Senior stakeholders rarely want more dashboards.
They want clearer answers.
Questions such as:
- Why did Campaign A outperform Campaign B?
- Which creative actually influenced engagement?
- Why are clicks increasing without conversions increasing?
- Which personalised version worked best?
- Where are customers abandoning the journey?
- Which elements should we change next time?
These questions cannot always be answered with top-level totals alone.
Connecting email engagement, View in Browser behaviour and website interactions gives CRM teams more evidence for explaining campaign outcomes.
---
Who Can Benefit From View in Browser Analytics?
CRM Managers
Understand a part of the campaign journey that may otherwise receive limited behavioural analysis.
Campaign Managers
Identify which VIB content and CTAs generate engagement.
Email Designers
See how layout, content hierarchy and CTA placement influence interaction.
Marketing Automation Teams
Connect campaign execution with post-inbox behavioural intelligence.
CRO and UX Teams
Investigate friction beyond the original email.
Marketing Leaders
Receive clearer visual evidence explaining why campaign experiences perform differently.
---
Questions CRM Teams Should Be Asking
After every major campaign, consider asking:
- How many customers used View in Browser?
- Which VIB elements received the most engagement?
- Which CTA attracted attention first?
- How far did users scroll?
- Which content sections were rarely reached?
- Did desktop and mobile behaviour differ?
- Which personalised version performed best?
- What happened when visitors continued to the website?
- Where did customers abandon the experience?
- What should we change in the next campaign?
If your current reporting cannot answer these questions, there may be an important visibility gap in your campaign analytics.
---
CRMx Does Not Replace Salesforce Marketing Cloud
CRMx is not intended to replace Salesforce Marketing Cloud.
SFMC remains the campaign execution and marketing automation platform.
CRMx provides an additional behavioural and visual analytics layer for supported implementations.
A simple way to think about the relationship is:
Salesforce Marketing Cloud helps you execute the campaign.
CRMx helps you investigate how customers interact with the experience.
Together, campaign metrics and behavioural evidence provide a more complete basis for optimisation.
---
From Reporting to Understanding
Marketing teams have spent years measuring:
- Opens
- Clicks
- CTR
- CTOR
- Conversions
The next step is understanding the experience behind those numbers.
Where did customers engage?
What did they ignore?
How far did they scroll?
Which version performed better?
What happened after they left the inbox?
Where did they abandon the wider journey?
These questions move marketing teams from simply reporting campaign performance toward understanding customer behaviour.
---
The View in Browser Journey Should Not Be a Blind Spot
When a customer clicks View in Browser, they have not necessarily finished interacting with your email.
They have simply moved into another environment.
That environment can contain valuable behavioural signals.
CRMx View in Browser analytics is designed to help marketing teams investigate those signals through capabilities such as:
- VIB engagement reporting
- Click heatmaps
- Mouse-movement heatmaps
- Scroll-depth analysis
- View in Browser session recordings
- Variant comparison
- Device and page-level analysis
- Website journey continuation
- End-to-end customer experience intelligence
The result is a clearer understanding of what happens between the original email and the eventual customer outcome.
---
Ready to Close Your Salesforce Marketing Cloud View in Browser Reporting Gap?
If your team invests heavily in Salesforce Marketing Cloud campaigns but loses visibility once recipients move from the inbox into the browser, CRMx can help you understand more of that journey.
See how CRMx can help your team analyse:
- Salesforce Marketing Cloud email heatmaps
- Dynamic and personalised email versions
- A/B through A–J comparisons
- View in Browser behaviour
- VIB heatmaps
- VIB session recordings
- Website and CloudPage behaviour
- End-to-end customer journey intelligence
Stop measuring only the click. Start understanding what happens after it.
"Request a personalised CRMx demo" (https://crmx.uk/request-demo)
"Explore CRMx Features & Benefits" (https://crmx.uk/features-benefits)