

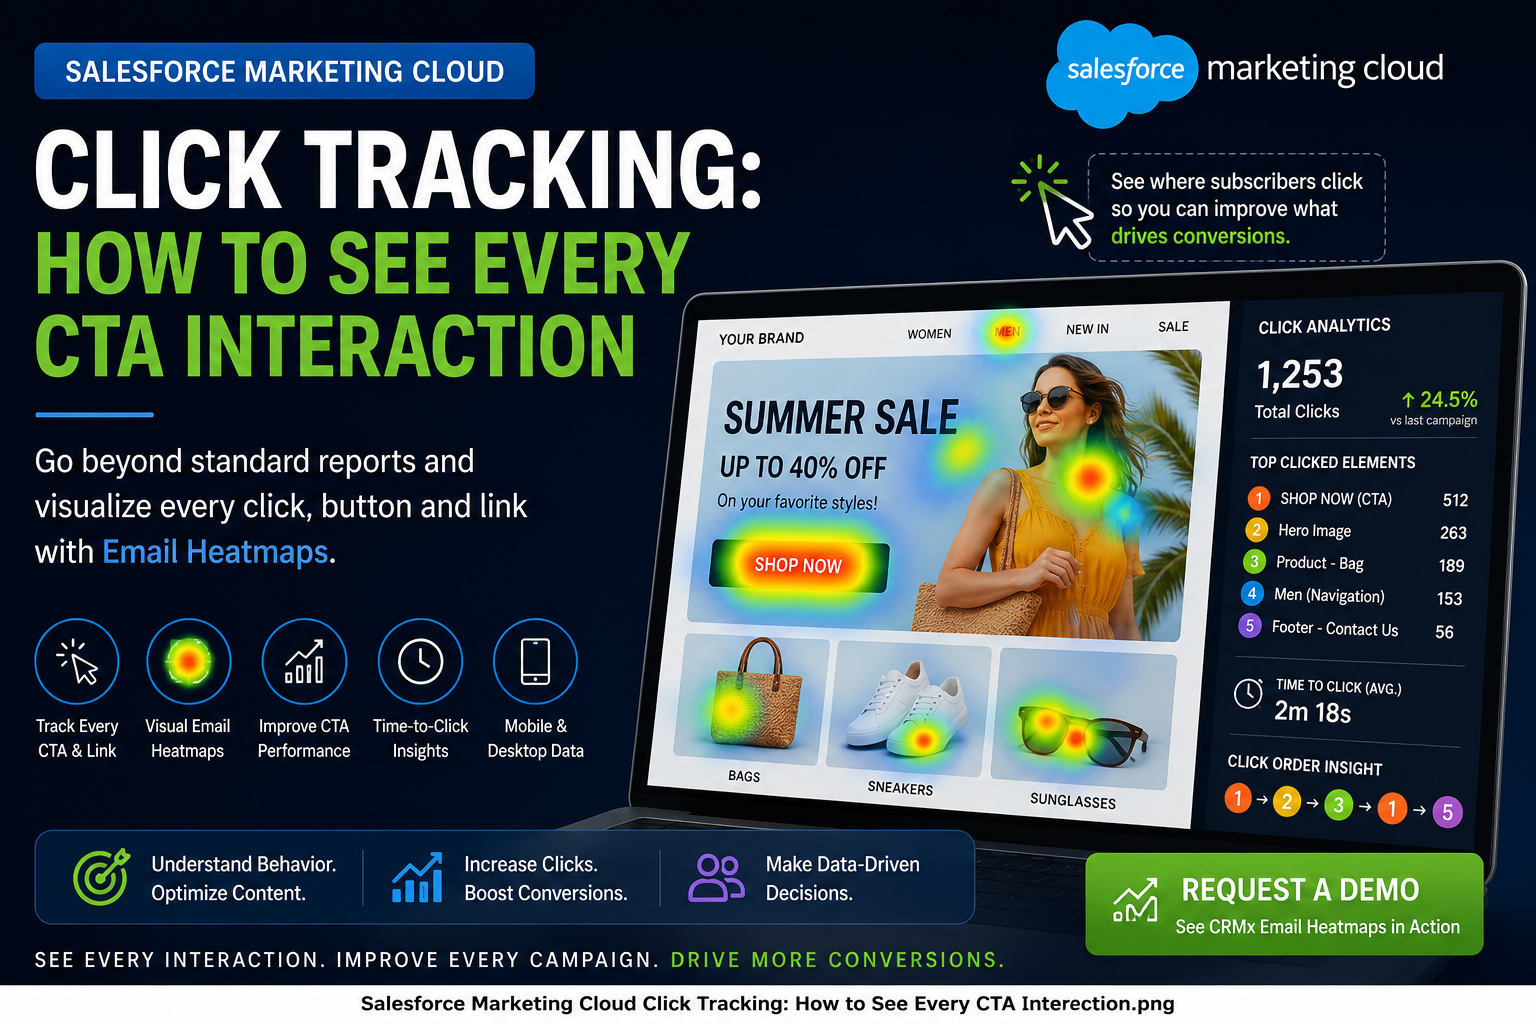

Salesforce Marketing Cloud Click Tracking: How to See Every CTA Interaction
Salesforce Marketing Cloud click tracking gives email teams valuable information about the links subscribers select after receiving a campaign.
You can measure total clicks, unique clicks, click-through rates and subscriber-level activity. However, standard click reports often present this information as tables containing URLs and numbers.
That tells you what was clicked, but it may not clearly show where the interaction happened inside the email.
Was the subscriber clicking the primary button, the hero image, a product card, the navigation menu or a secondary text link? Did personalised campaign versions produce different CTA behaviour? Which element attracted the first click?
To answer these questions, Salesforce Marketing Cloud teams need to connect tracking data with the actual email creative.
That is where email heatmap intelligence becomes valuable.
How Salesforce Marketing Cloud Click Tracking Works
When a tracked Salesforce Marketing Cloud email is sent, links within the email can be redirected through tracking URLs.
When a recipient selects a tracked link, the interaction is recorded before the subscriber reaches the final destination.
This allows campaign teams to measure metrics such as:
Total clicks
Unique clicks
Click-through rate
Click-to-open rate
Subscriber-level link activity
Individual URL performance
Campaign and Journey Builder engagement
These metrics are essential for campaign reporting. However, a list of links does not always explain the role each link played within the email design.
A URL report may show that one destination received 600 clicks. It may not immediately tell a stakeholder whether those clicks came from the hero image, a CTA button, a product tile or several repeated links pointing to the same page.
Why CTA-Level Tracking Matters
Every email should have a clear purpose.
The campaign may be designed to generate a purchase, registration, download, booking, store visit or demonstration request.
The primary CTA should therefore attract a meaningful share of subscriber engagement.
But an email can produce a strong overall click-through rate while the most important CTA performs poorly.
For example, subscribers may be selecting:
The company logo
Top navigation links
Hero images
Product images
Social media icons
Footer links
View in Browser links
These interactions increase the campaign’s click count, but they may not support the main conversion goal.
CTA-level analysis helps marketers separate general engagement from conversion-focused engagement.
Track Buttons, Images and Text Links Separately
One destination may appear several times inside an email.
A hero image, a “Learn More” button and a supporting text link could all direct subscribers to the same landing page.
If these elements are not clearly identified, the campaign report may make it difficult to determine which placement generated the interaction.
Each linked element should use a meaningful tracking name, alias or title.
For example:
Hero_Image_Summer_Offer
Primary_CTA_Shop_Now
Product_01_Image
Product_01_CTA
Footer_Request_Demo
This naming structure makes reports easier to understand and allows each creative element to be analysed independently.
Consistent tracking names are particularly important when the same destination appears multiple times within one email.
Use Meaningful Link Aliases
Generic link names such as “Click Here”, “CTA” or “Button One” provide limited reporting value.
A strong alias should explain:
Where the link appears
What content it represents
What action the subscriber is expected to take
A useful Salesforce Marketing Cloud link alias could follow a structure such as:
EmailSection_Content_Action
Examples include:
Hero_NewCollection_ShopNow
ProductBlock_Handbags_ViewRange
ContentBlock_CustomerStory_ReadMore
Footer_Demo_RequestDemo
Navigation_Women_ShopCategory
This makes reporting more understandable for marketers, developers, designers and stakeholders.
It also supports email heatmap overlays because tracked links can be accurately connected to their positions inside the email creative.
Visualise CTA Interactions With Email Heatmaps
An email heatmap displays engagement directly over the rendered email.
Instead of reviewing click counts separately, teams can see visual activity across the creative.
High-engagement areas may appear as warmer colours, while lower-engagement areas appear cooler or show little activity.
This allows campaign teams to identify:
The most-clicked CTA
Images attracting more clicks than buttons
Content sections receiving little engagement
Navigation links distracting subscribers
Product cards generating the strongest interest
Lower sections subscribers continue to interact with
CTAs that may need stronger placement or wording
CRMx Email Heatmaps add this visual layer to Salesforce Marketing Cloud campaign reporting.
The objective is not to replace SFMC click tracking. It is to make the captured data easier to interpret and act upon.
Measure More Than Total Clicks
Total clicks alone do not provide the full picture.
A subscriber may select the same link several times, while another subscriber may interact with several different CTAs.
A complete CTA analysis should consider:
Unique clicks
Unique clicks show how many individual subscribers selected an element.
This helps distinguish broad audience interest from repeated activity by a smaller group.
Total clicks
Total clicks show all recorded interactions, including repeated clicks.
This can indicate strong interest, repeated visits or, in some cases, automated link scanning.
Click order
Click-order reporting reveals which link a subscriber selected first, second or later.
The first click can be particularly valuable because it indicates which element initially attracted attention.
Time to click
Time-to-click analysis shows how quickly subscribers interacted after receiving the campaign.
Immediate clicks may suggest urgency or strong intent. Later clicks may indicate that subscribers returned to the email after considering the offer.
Click concentration
Click concentration shows whether engagement is focused on the primary conversion path or distributed across many competing elements.
Track Dynamic and Personalised CTA Variations
Salesforce Marketing Cloud emails frequently use dynamic content based on customer attributes.
Examples include:
Country
Language
City
Customer segment
Product affinity
Membership level
Lifecycle stage
Previous purchases
Each recipient may see a different headline, image, product selection or CTA.
When all interactions are combined into one aggregated report, teams can lose visibility into how each variation performed.
A CTA saying “Book Your Journey” may perform strongly for one market, while another market responds better to “Explore the Offer”.
CRMx can help campaign teams analyse dynamic email variations separately, allowing them to compare different:
Headlines
Images
Offers
CTA labels
CTA destinations
Countries
Languages
Audience groups
This gives marketers more reliable evidence for improving personalisation strategies.
Review View in Browser Interactions
Some subscribers choose to open an email using the View in Browser link.
The browser-rendered version may create additional engagement that is not fully explained by the original email click report.
CRMx View in Browser analytics can help teams extend their visibility beyond the inbox.
Depending on the implemented tracking setup, teams can analyse browser-version activity such as:
Link clicks
CTA interactions
Scroll behaviour
Mouse movement
Device and platform information
Session activity
This provides a more connected view of the customer journey from the email to the browser-rendered message and then to the website.
Watch for Automated Security Clicks
Some recorded interactions may be created by security systems rather than subscribers.
Corporate firewalls and email security tools can scan links before delivering a message to the recipient.
Warning signs can include:
Every link being clicked immediately
Legal and footer links receiving identical clicks
Several interactions occurring within seconds
High click activity without corresponding conversions
Unusual engagement concentrated within one company domain
Campaign teams should review suspicious patterns before using the data to make optimisation decisions.
Visual heatmaps, click timing and click-order information can help identify activity that does not resemble normal subscriber behaviour.
Turn CTA Tracking Into Better Conversions
Salesforce Marketing Cloud click tracking becomes more valuable when it leads to specific campaign improvements.
After reviewing an email, identify:
The CTA with the most unique clicks
The element that received the first interaction
The primary CTA’s share of total engagement
The highest-performing content block
Links distracting subscribers from the main goal
Dynamic variations producing the strongest response
One design or content change for the next campaign
These findings can help improve CTA hierarchy, campaign layouts, personalisation, content selection and conversion journeys.
See Every Tracked CTA Interaction With CRMx
CRMx transforms Salesforce Marketing Cloud click data into visual email intelligence.
Marketing teams can use CRMx to:
View clicks directly over email creatives
Measure individual button, image and text-link engagement
Compare total and unique clicks
Analyse click order
Measure time-to-click behaviour
Review high-, medium- and low-engagement areas
Compare dynamic email versions
Analyse supported View in Browser activity
Share clear visual reports with stakeholders
Standard click reports tell you which links were selected.
CRMx helps you understand where subscribers interacted, which CTA captured attention and how the email can be improved to generate more conversions.
Explore the CRMx Email Heatmap features and benefits to see how visual click intelligence can strengthen your Salesforce Marketing Cloud reporting.
Ready to discover how subscribers interact with every tracked CTA in your emails?
Request a personalised CRMx demonstration and turn Salesforce Marketing Cloud click data into clearer campaign decisions.