

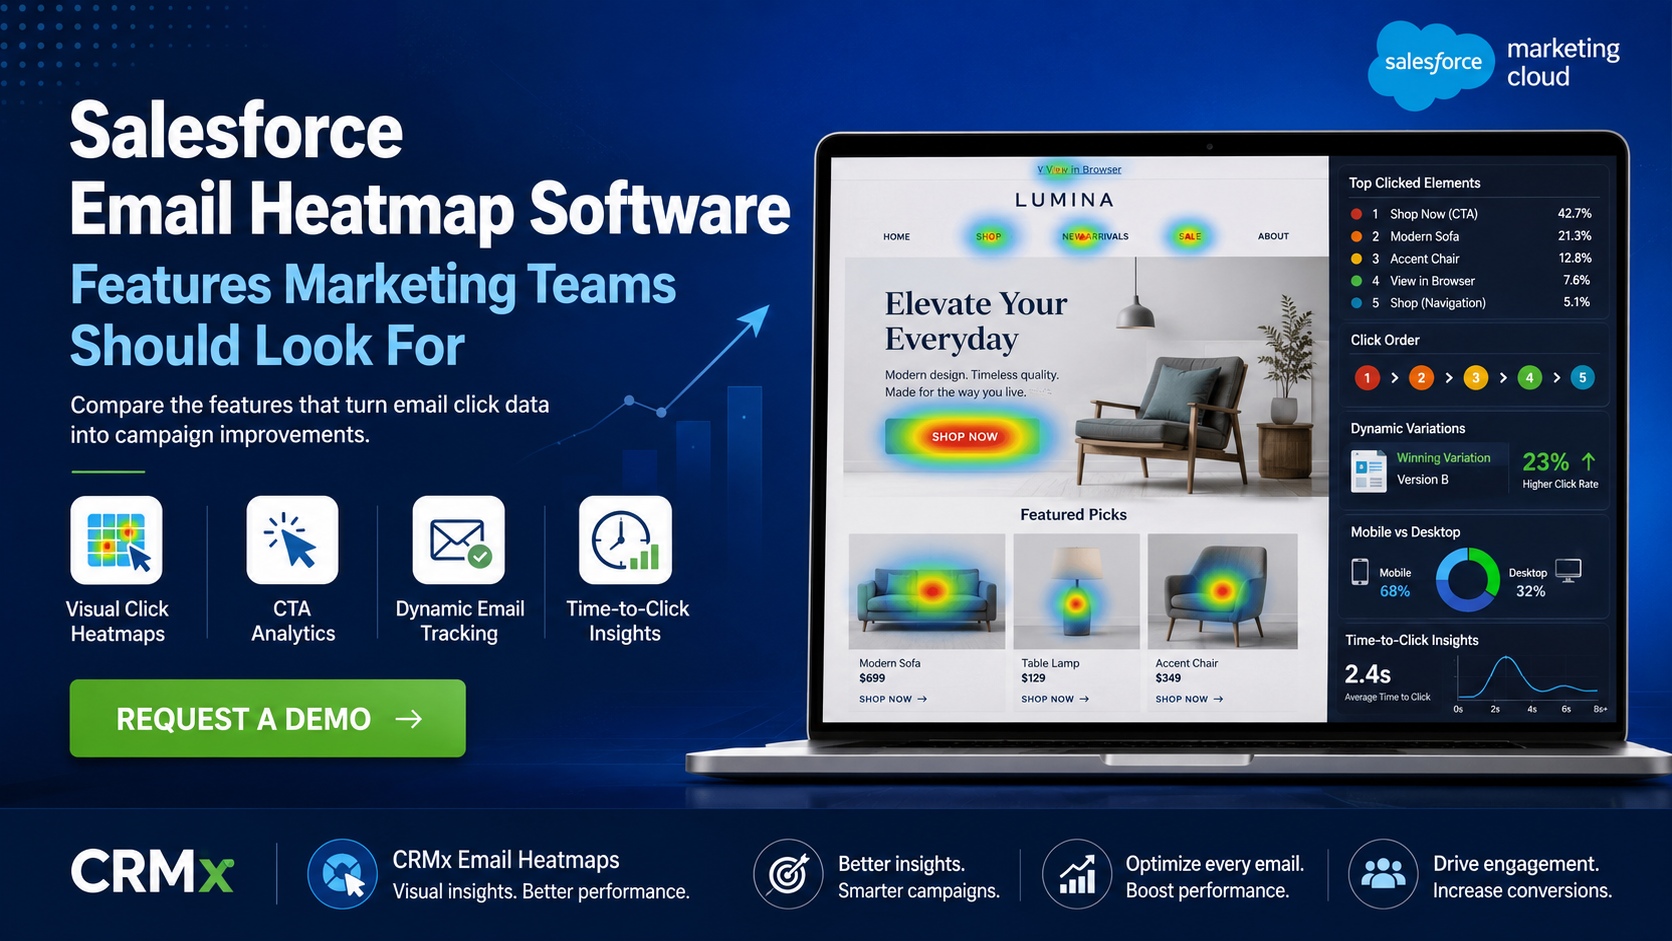

Salesforce Email Heatmap Software: Features Marketing Teams Should Look For
Salesforce Marketing Cloud gives email teams access to valuable campaign metrics, including sends, opens, clicks, click-through rates, bounces and unsubscribes.
These metrics help marketers measure performance, but they do not always make it easy to understand how customers interacted with the actual email design.
Which CTA attracted the most attention? Did subscribers click the hero image instead of the primary button? Which product block performed best? Did customers engage with content near the bottom of the email? Did personalised email versions produce different results?
Salesforce email heatmap software helps answer these questions by displaying engagement directly over the email creative.
However, not every heatmap platform offers the same level of insight.
Marketing teams should therefore evaluate more than the visual appearance of the heatmap. The right solution should help teams understand customer behaviour, compare campaign variations and turn click data into practical improvements.
Here are the most important features Salesforce Marketing Cloud teams should look for.
1. Visual Click Overlays
The most basic requirement is the ability to display click activity directly over the email.
Instead of reviewing URLs and click counts in separate tables, marketers should be able to see where engagement occurred within the creative.
A strong heatmap should clearly highlight:
Primary CTA buttons
Hero images
Product cards
Text links
Navigation links
Social icons
Footer links
View in Browser links
High-engagement areas should be easy to distinguish from medium- and low-engagement areas.
This visual context allows teams to understand campaign performance quickly and makes reporting easier for designers, CRM managers, senior stakeholders and agencies.
2. Individual Element Tracking
Several email elements may point to the same destination.
For example, a hero image, CTA button and supporting text link may all direct customers to one landing page.
If the reporting only groups interactions by destination URL, teams may struggle to understand which element actually generated the click.
Salesforce email heatmap software should allow each linked element to be identified separately.
Marketing teams should be able to compare:
Button clicks
Image clicks
Headline clicks
Product-link clicks
Navigation clicks
Footer-link clicks
Clear link aliases, titles or tracking names make this possible.
For example:
Hero_Image_SummerSale
Hero_CTA_ShopNow
Product01_Image
Product01_ViewProduct
Footer_RequestDemo
This level of detail helps teams determine whether creative placement or CTA design influenced engagement.
3. Total and Unique Click Analysis
Total clicks and unique clicks reveal different customer behaviours.
Total clicks show every recorded interaction, including repeated clicks by the same subscriber.
Unique clicks show how many individual customers engaged with a link or email element.
The software should allow teams to compare both.
A high number of total clicks with relatively few unique clicks may indicate repeated interest from a smaller audience.
A high number of unique clicks may indicate broader engagement across the subscriber base.
Marketing teams should not be forced to choose between visual reporting and detailed metrics. The strongest platforms combine both.
4. CTA Ranking
The software should rank the most-clicked elements inside the email.
This helps teams quickly identify:
The strongest CTA
The most-clicked image
The best-performing product
Navigation links attracting attention
Secondary links competing with the campaign goal
CTA ranking is especially important because a high overall click-through rate does not always mean the primary conversion CTA performed well.
Customers may be clicking logos, category links, social icons or supporting content instead.
A ranked view helps teams distinguish conversion-focused engagement from general interaction.
5. Click-Order Analytics
Knowing which links customers clicked is valuable.
Knowing which link they clicked first can be even more useful.
Click-order analytics reveal the sequence in which subscribers interacted with the email.
This can help answer:
Which element captured attention first?
Did customers select the primary CTA before other links?
Did they skip the hero section?
Did a product image attract the first interaction?
Did navigation distract from the main campaign action?
The first click often provides the clearest indication of immediate customer interest.
Salesforce email heatmap software should therefore show more than total engagement. It should help teams understand the customer’s path through the email.
6. Time-to-Click Reporting
Time-to-click analytics show how quickly subscribers interacted after receiving an email.
This can reveal the strength and urgency of customer intent.
Fast clicks may indicate:
Strong offer relevance
Immediate product interest
Effective urgency messaging
High purchase intent
Strong subject-line and email alignment
Slower clicks may indicate that customers returned to the email later or required more consideration.
Time-to-click reporting is particularly valuable for:
Limited-time promotions
Product launches
Event registrations
Abandoned basket campaigns
Appointment reminders
B2B lead-generation emails
The software should allow teams to analyse average time to click and, ideally, group interactions into meaningful time ranges.
7. Dynamic Email Variation Tracking
Salesforce Marketing Cloud is often used to deliver personalised and dynamic emails.
Different customers may receive different:
Headlines
Hero images
Products
Offers
Languages
CTA wording
CTA destinations
Content blocks
When every variation is combined into one report, important performance differences can be hidden.
The heatmap platform should allow teams to separate and compare dynamic variations.
Marketing teams should be able to analyse engagement by:
Country
City
Language
Customer segment
Product affinity
Dynamic image
Dynamic headline
Personalised CTA
Content variation
This is one of the most important features for enterprise Salesforce Marketing Cloud teams managing multiple markets, languages or customer segments.
8. Campaign and Version Comparison
Heatmaps become more valuable when teams can compare different campaigns and creative versions.
The software should support comparison across:
A/B tests
Hero-image variations
CTA wording
Button placement
Product order
Email length
Navigation structures
Personalised content
Different campaign sends
A standard report may show that Version B achieved a higher click-through rate.
A heatmap comparison should help explain why.
It may reveal that the primary CTA received more attention, one product image attracted most of the clicks or the simplified navigation reduced distractions.
This insight makes A/B testing more actionable.
9. Mobile and Desktop Analysis
Customers behave differently depending on the device they use.
On mobile, subscribers see less content before scrolling. Button size, image stacking and content order can therefore have a major impact on click behaviour.
The software should help teams compare:
Mobile and desktop engagement
CTA performance by device
Click distribution by layout
Product interactions by screen type
Engagement with lower content sections
If mobile users only interact with the first visible section, important content may need to be moved higher.
If desktop users engage with more products, the mobile version may be too long or difficult to navigate.
Device-level insight helps teams improve responsive email design.
10. View in Browser Analytics
Some customers leave the inbox by selecting the View in Browser link.
The original email report may record that click, but the customer can continue interacting with the browser-rendered version.
A more advanced platform should provide visibility into supported View in Browser behaviour.
This may include:
Browser-page clicks
CTA interactions
Scroll activity
Mouse movement
Device information
Platform information
Session behaviour
Movement from the browser version to the website
This extends the customer journey beyond the inbox and helps teams understand what happens after the email is opened in a browser.
11. Automated Click Identification
Not every recorded click necessarily comes from a human subscriber.
Security tools, corporate firewalls and email scanners may automatically check links before delivering the message.
This can create misleading click data.
Marketing teams should look for software that helps identify unusual patterns, such as:
Every link being clicked immediately
Legal and footer links receiving identical activity
Multiple clicks within seconds
High click rates without conversions
Suspicious activity from one corporate domain
Click timing, sequence and visual distribution can all help teams investigate possible automated activity.
Without this context, teams may optimise campaigns based on inaccurate engagement signals.
12. Easy-to-Understand Stakeholder Reporting
The platform should make email performance easy to explain.
Salesforce Marketing Cloud reports may be familiar to CRM specialists, but senior stakeholders, designers and business teams may find visual heatmaps easier to understand.
Look for reporting that clearly communicates:
The most-clicked CTA
High- and low-engagement sections
Click concentration
Dynamic variation performance
Click order
Time-to-click behaviour
Campaign-to-campaign improvements
The software should reduce the time required to prepare presentations and explain results.
A strong visual report can help stakeholders understand campaign performance without reviewing technical link tables.
13. Salesforce Marketing Cloud Integration
General website heatmap tools are not necessarily suitable for Salesforce Marketing Cloud emails.
Email tracking has different requirements from website tracking.
The platform should be designed to work with SFMC campaign data, link tracking, personalised content and email-rendering processes.
Marketing teams should evaluate:
How the solution captures SFMC click data
Whether link aliases and titles are supported
How dynamic content is handled
Whether the email creative is rendered accurately
How reports are connected to campaigns and sends
Whether implementation support is provided
The strongest solution should complement Salesforce Marketing Cloud rather than create an entirely separate reporting process.
Why CRMx Is Built for SFMC Marketing Teams
CRMx adds visual and behavioural intelligence to Salesforce Marketing Cloud campaigns.
Marketing teams can use CRMx to:
Display clicks directly over email creatives
Compare buttons, images and text links
Rank top-performing CTAs
Analyse total and unique clicks
Understand click order
Measure time-to-click behaviour
Compare dynamic and personalised variations
Review mobile and desktop behaviour
Analyse supported View in Browser activity
Share visual reports with stakeholders
Turn campaign data into practical improvements
CRMx does not replace Salesforce Marketing Cloud reporting.
It adds the visual context and behavioural detail teams need to understand why customers clicked and how the next campaign can perform better.
Choose Software That Improves Decisions
The best Salesforce email heatmap software should do more than create a colourful overlay.
It should help marketing teams understand customer behaviour, identify conversion opportunities, compare personalised content and improve campaign performance over time.
Before choosing a platform, evaluate whether it can answer these questions:
Which CTA attracted the most attention?
Which element received the first click?
How quickly did customers interact?
Which personalised version performed best?
Did mobile and desktop users behave differently?
Were clicks concentrated around the conversion goal?
What should the team change in the next campaign?
When the software can answer these questions clearly, email heatmaps become more than a reporting feature.
They become a campaign optimisation system.
Explore the CRMx Email Heatmap features and benefits.
Ready to see how Salesforce Marketing Cloud customers interact with every CTA, image and content block?
Request a personalised CRMx demonstration and discover which email heatmap features can help your team improve engagement and conversions.