

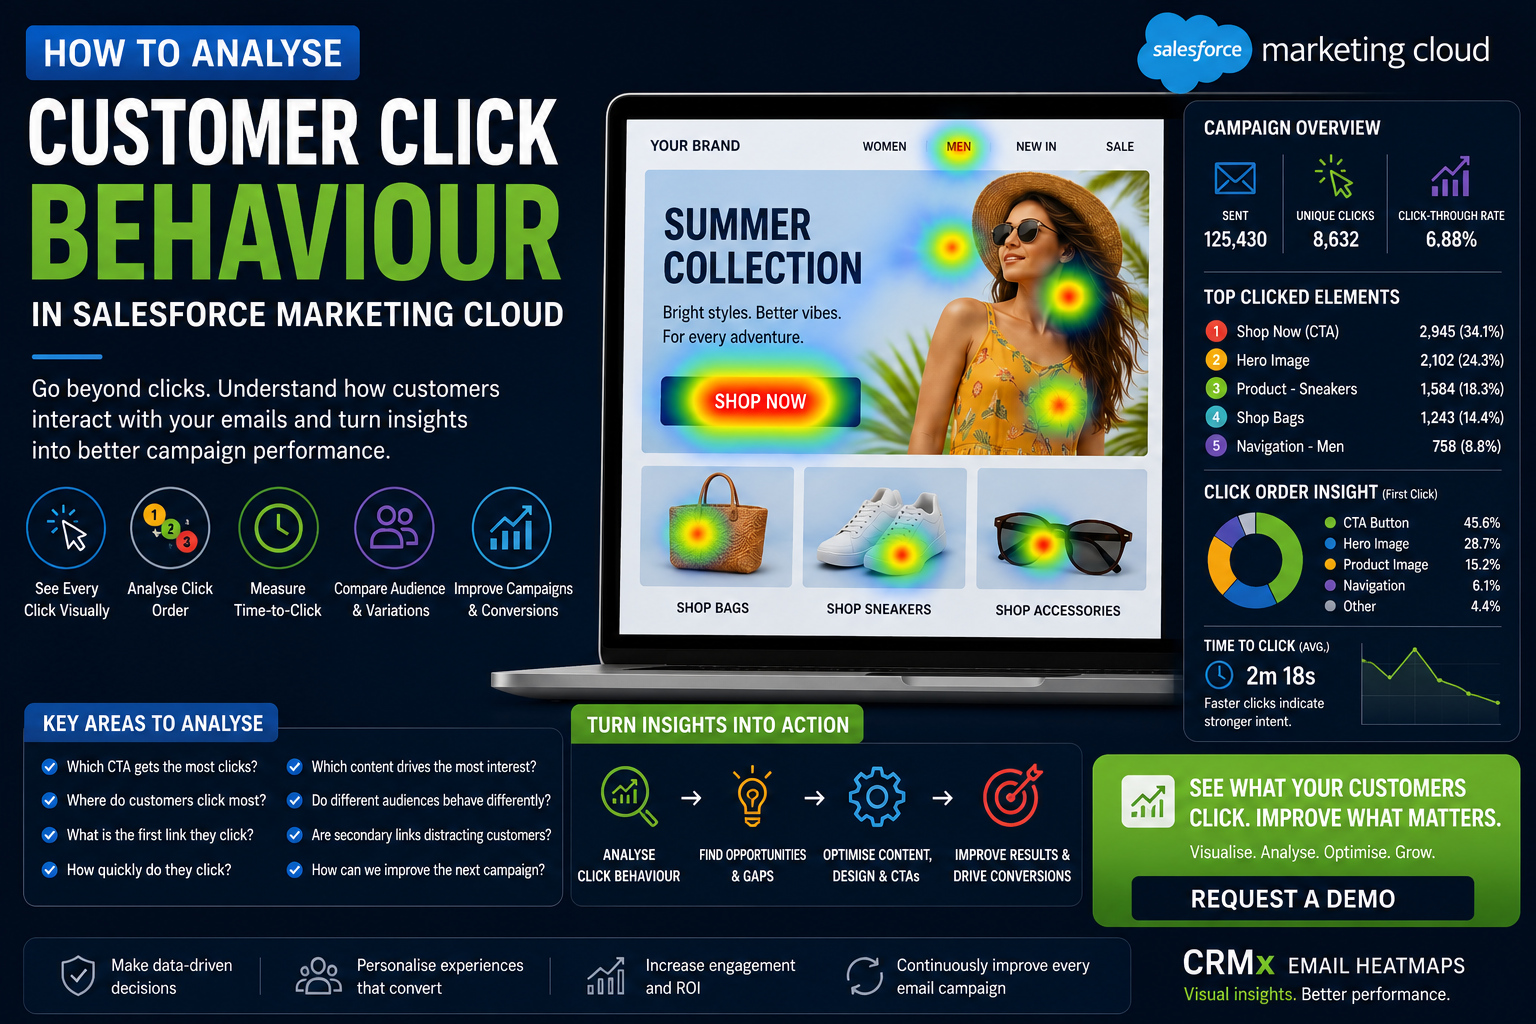

How to Analyse Customer Click Behaviour in Salesforce Marketing Cloud
Salesforce Marketing Cloud gives email teams access to valuable engagement information, including link clicks, total clicks, unique clicks and subscriber-level activity.
However, analysing customer click behaviour requires more than checking which campaign achieved the highest click-through rate.
To understand how customers actually interact with an email, marketers need to examine which elements were clicked, when the interactions occurred, which link received the first click and whether customers followed the intended conversion path.
Salesforce Marketing Cloud Email Studio uses link redirection to record tracked link activity before sending the customer to the final destination. Its tracking tools can therefore show engagement across emails, links and subscribers.
The challenge is turning this raw click data into practical campaign improvements.
Start with the Campaign Objective
Before analysing customer clicks, define the main action the email was designed to generate.
The objective may be to:
Complete a purchase
Register for an event
Book an appointment
Download a document
Visit a product page
Activate an account
Find a nearby store
Request a demonstration
This primary objective provides the context needed to interpret the click data correctly.
An email may generate a high number of interactions, but those clicks do not necessarily mean the campaign successfully supported its goal.
For example, customers may click the logo, navigation menu, social media icons or footer links while ignoring the primary “Shop Now” or “Request a Demo” CTA.
The most important question is not simply, “How many clicks did the email receive?”
The better question is, “How many customers clicked the elements that moved them towards the intended conversion?”
Compare Total Clicks and Unique Clicks
Total clicks and unique clicks reveal different types of customer behaviour.
Total clicks include every recorded interaction, including repeated clicks by the same subscriber.
Unique clicks generally count an individual subscriber once for unique-click reporting, even when they interact more than once within the relevant tracking context. Salesforce records click and open activity against the original subscriber associated with the send.
A link with many total clicks but relatively few unique clicks may indicate that a smaller group of customers returned to the destination several times.
A link with a high number of unique clicks may indicate broader audience interest.
Review both metrics to understand whether engagement is widespread or concentrated among a limited number of subscribers.
Analyse Every CTA Separately
Every linked element should be identified and measured independently.
This includes:
Primary CTA buttons
Secondary buttons
Hero images
Product images
Headlines
Text links
Navigation links
Social media icons
Footer links
View in Browser links
Several creative elements may direct customers to the same landing page. If all these interactions are grouped only by the destination URL, marketers may struggle to determine which placement generated the click.
For example, a hero image, supporting text link and “Learn More” button could all point to one product page.
Use clear link names, aliases or titles such as:
Hero_Image_NewCollection
Hero_CTA_ShopNow
Product01_Image
Product01_ViewProduct
Footer_CTA_RequestDemo
This makes link-level reporting easier to understand and helps associate each interaction with the correct element inside the email.
Calculate the Primary CTA Click Share
One useful way to evaluate customer behaviour is to calculate how much of the email’s engagement was generated by the primary CTA.
For example:
Primary CTA unique clicks ÷ total unique email clicks × 100
If the main CTA generated only a small proportion of overall engagement, customers may have been distracted by other links.
Possible reasons include:
The CTA was positioned too low
The wording was unclear
The button did not stand out visually
The hero image was more attractive than the CTA
Too many secondary links competed for attention
The offer did not match the campaign message
This analysis can help teams determine whether the email created a focused conversion journey or simply generated scattered interactions.
Use Email Heatmaps to See Click Position
Traditional click reports usually separate engagement numbers from the email creative.
An email heatmap connects the two by displaying click activity directly over the rendered email.
This makes it easier to see:
Which sections attracted the most attention
Whether customers clicked buttons or images
Which product cards performed best
Whether lower sections generated engagement
Whether navigation links caused distraction
Which content customers ignored
Heatmaps help marketers analyse customer behaviour visually instead of manually comparing link tables with the original email.
CRMx Email Heatmaps can highlight high-, medium- and low-engagement areas, allowing campaign teams to understand the distribution of customer attention across the email.
Examine the First Click
The first link selected by a customer can reveal which part of the email captured their attention most quickly.
Click-order analysis can help answer:
Did the customer click the primary CTA first?
Did they interact with the hero image before the button?
Did they select a product before reading the main offer?
Did they leave through the navigation menu?
Did a secondary link distract from the campaign objective?
For example, if customers repeatedly select a category navigation link before the main promotional CTA, the campaign may not be focused enough.
If a product image consistently receives the first click, the visual content may be generating stronger interest than the headline or offer.
These insights can help teams improve content hierarchy and CTA placement.
Review Time-to-Click Behaviour
Time-to-click analysis shows how quickly customers interact after an email is delivered.
Fast clicks may indicate:
Immediate interest
Strong customer intent
A relevant offer
Effective urgency
A highly recognisable product
Slower clicks may indicate that customers returned to the email later, needed more time to make a decision or interacted after receiving another reminder.
Time-to-click analysis is particularly useful for:
Limited-time promotions
Abandoned basket campaigns
Product launches
Event registrations
Appointment reminders
Journey Builder follow-ups
B2B lead-generation emails
Customers who click quickly but do not convert may be suitable for timely follow-up or retargeting.
Compare Behaviour Across Devices
Customers may interact differently depending on whether they open the email on mobile or desktop.
Mobile users often see less content before scrolling. Button size, content order, image stacking and navigation placement can therefore influence click behaviour.
Compare whether mobile and desktop customers:
Select the same primary CTA
Interact with the same content blocks
Reach content lower in the email
Prefer images over buttons
Click navigation links differently
Follow the same conversion path
If mobile customers interact mainly with the first visible section, important content may need to be moved higher.
If desktop customers engage with more content blocks, the mobile version may be too long or difficult to navigate.
Compare Dynamic Content Variations
Salesforce Marketing Cloud is frequently used to personalise emails based on customer data.
Different customers may receive different:
Hero images
Headlines
Products
Languages
Offers
CTA labels
CTA destinations
Content blocks
When every dynamic version is combined into one aggregated report, important differences can be hidden.
Analyse customer click behaviour by:
Country
Language
City
Audience segment
Product affinity
Customer lifecycle stage
Dynamic headline
Dynamic image
Personalised CTA
CRMx can help teams compare separate dynamic email variations and identify which personalised content produces the strongest engagement.
This allows marketers to improve personalisation using real behavioural evidence rather than assumptions.
Compare Click Behaviour Across Campaigns
Avoid analysing each campaign in isolation.
Compare click behaviour across similar campaigns to identify repeated patterns.
Look for changes in:
Primary CTA engagement
Hero-image clicks
Product-category interest
Click concentration
First-click behaviour
Time to click
Mobile engagement
Dynamic-version performance
For example, moving the primary CTA above the first product block may increase its share of unique clicks.
Removing unnecessary navigation links may concentrate engagement around the main conversion action.
Over time, these comparisons create a clearer understanding of what customers respond to.
Account for Automated Click Activity
Not every recorded click necessarily represents a human customer.
Salesforce explains that security systems, antivirus tools and anti-spam applications may scan email links, causing opens and clicks to appear in tracking data. Common warning signs include large numbers of clicks immediately after delivery or security systems scanning many links in the same message.
Investigate patterns such as:
Every link being clicked within seconds
Legal and footer links receiving unusual engagement
Immediate clicks after the send
High click rates without corresponding conversions
Multiple links clicked in an unrealistic sequence
Click activity concentrated within one company domain
Salesforce also notes that recorded engagement can be associated with the original subscriber even when an email is forwarded, which is another reason to interpret subscriber-level click data carefully.
Turn Click Behaviour into Campaign Actions
After analysing an email, document the most important findings.
Record:
The most-clicked element
The primary CTA’s share of engagement
The first link commonly selected
The content customers ignored
The fastest-clicking audience segment
The strongest dynamic variation
Differences between mobile and desktop
One change for the next campaign
Possible improvements may include:
Moving the main CTA higher
Simplifying navigation
Removing low-value links
Reordering product blocks
Changing CTA wording
Shortening the email
Personalising content by audience
Adjusting follow-up timing
This creates a repeatable optimisation process rather than treating click reporting as a one-time campaign summary.
Understand Customer Click Behaviour with CRMx
Salesforce Marketing Cloud provides the underlying engagement events and tracking data.
CRMx adds the visual and behavioural context needed to understand how customers interact with the email creative.
CRMx Email Heatmaps can help teams:
Display clicks directly over emails
Compare buttons, images and text links
Identify high- and low-engagement areas
Analyse total and unique clicks
Review click order
Measure time-to-click behaviour
Compare mobile and desktop interactions
Separate dynamic email variations
Analyse supported View in Browser activity
Share visual campaign insights with stakeholders
Standard reports show that a customer clicked.
CRMx helps reveal where the interaction happened, which content attracted attention and how the next campaign can perform better.
Explore the CRMx Email Heatmap features and benefits.
Ready to understand how customers interact with your Salesforce Marketing Cloud emails?
Request a personalised CRMx demonstration and turn customer click behaviour into actionable campaign intelligence.