

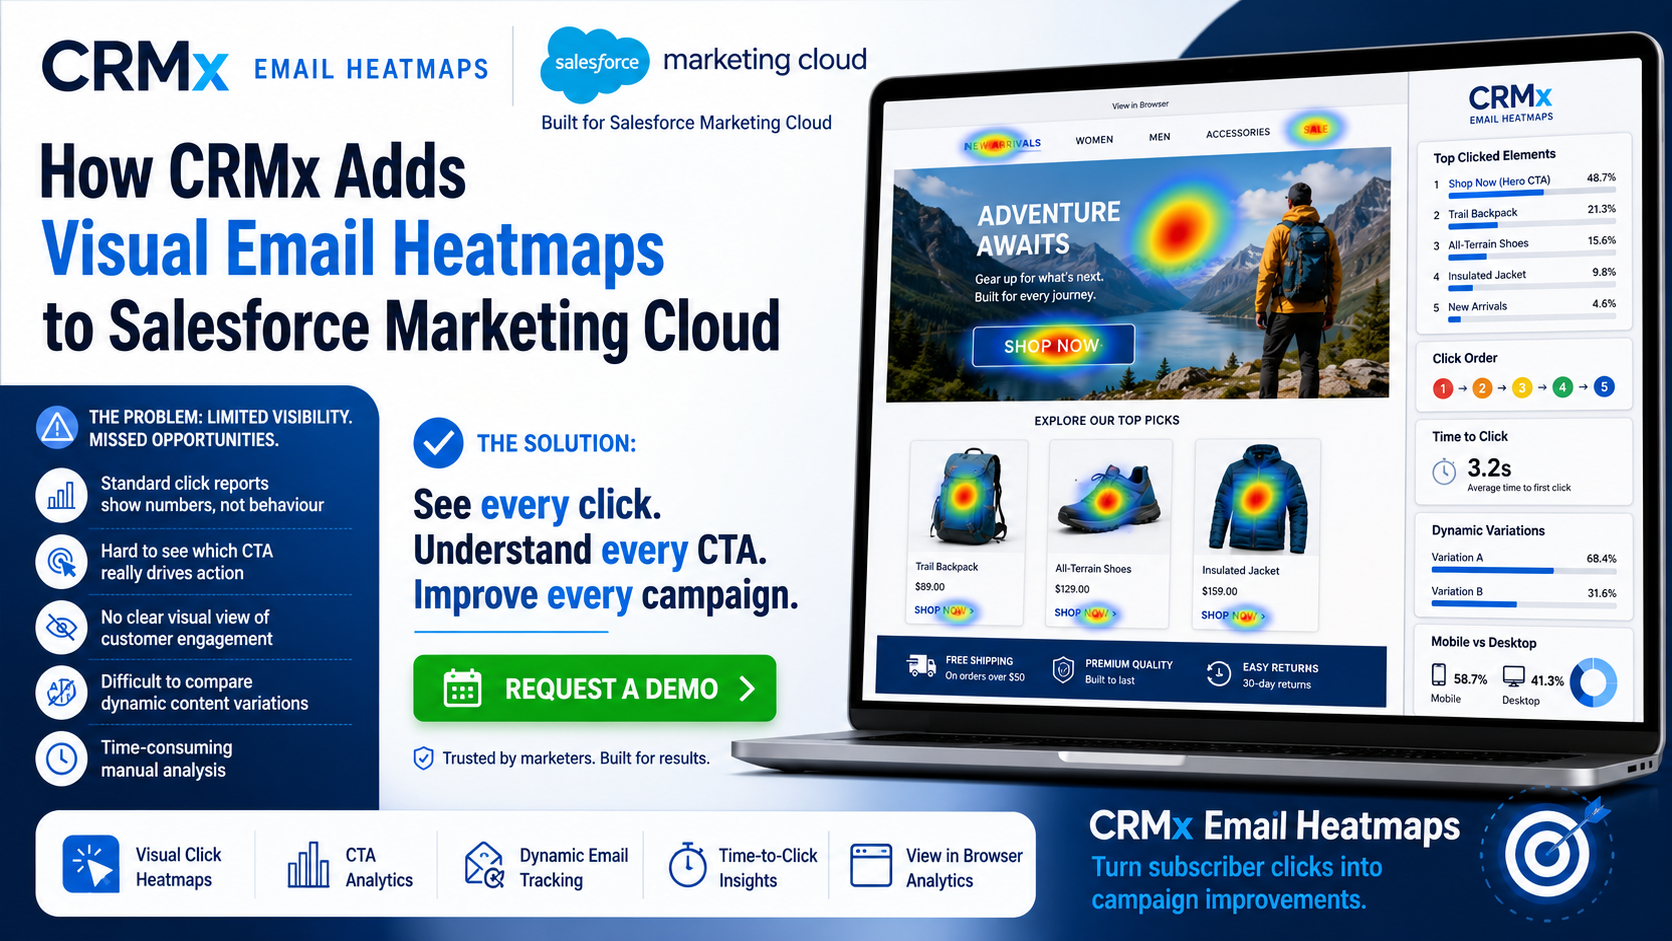

How CRMx Adds Visual Email Heatmaps to Salesforce Marketing Cloud
Salesforce Marketing Cloud gives email teams access to important campaign metrics such as sends, opens, total clicks, unique clicks, click-through rates, bounces and unsubscribes.
These metrics help marketers understand whether engagement happened.
However, standard reports do not always make it easy to see how subscribers interacted with the actual email design.
A campaign report may show that one link generated 800 clicks while another generated 250. But marketers may still need to open the original email, identify where each link appeared and determine whether the clicks came from a hero image, CTA button, product card, navigation link or supporting text.
CRMx adds a visual email heatmap layer to Salesforce Marketing Cloud, helping teams connect click data with the email creative.
Instead of reviewing links and numbers separately, marketers can see where customers clicked directly over the rendered email.
What Is a Visual Email Heatmap?
A visual email heatmap displays customer click activity over the original email design.
High-engagement areas are highlighted using warmer colours, while lower-engagement areas appear cooler or show less activity.
This makes it easier to identify:
The most-clicked CTA
High-performing images
Popular product cards
Navigation links attracting attention
Content sections subscribers ignored
Lower sections that continued to generate engagement
Links distracting customers from the primary conversion goal
The heatmap provides visual context that traditional click tables cannot always communicate clearly.
For CRM managers, email developers, campaign teams and senior stakeholders, this makes campaign performance easier to analyse and explain.
CRMx Works Alongside Salesforce Marketing Cloud
CRMx does not replace Salesforce Marketing Cloud.
Salesforce Marketing Cloud remains the platform used to create, personalise, send and track email campaigns.
CRMx adds another layer of visual and behavioural analysis.
The process can be understood in four stages:
Salesforce Marketing Cloud sends the email.
Customer click activity is recorded.
CRMx connects tracked links with the rendered email creative.
The engagement is displayed as a visual email heatmap.
This allows teams to continue using their existing Salesforce Marketing Cloud campaign process while gaining more detailed visual insight into subscriber behaviour.
See Every CTA, Image and Link in Context
Standard reports may show individual URLs and click totals.
CRMx shows where those interactions occurred inside the email.
For example, an email may include:
A hero image
A primary “Shop Now” button
Four product cards
A navigation menu
A secondary CTA
Social media links
A View in Browser link
CRMx can help teams understand which of these elements attracted the most attention.
This is important because not every click has the same business value.
A click on the company logo does not necessarily indicate the same level of intent as a click on “Request a Demo”, “Buy Now” or “Register Today”.
By displaying clicks over each individual element, CRMx helps teams distinguish general interaction from conversion-focused engagement.
Link Aliases and Titles Support Accurate Heatmaps
For email heatmaps to provide useful element-level reporting, links need to be identified clearly.
CRMx can use meaningful link aliases and title attributes to connect tracked click activity with the correct position inside the email.
For example:
Hero_Image_SummerCampaign
Hero_CTA_ShopNow
Product01_Image
Product01_ViewProduct
Footer_RequestDemo
This naming structure helps separate clicks even when several elements direct customers to the same destination.
Without clear link naming, a report may show that one landing page generated clicks but not which email element produced them.
With meaningful aliases and titles, CRMx can show the engagement of each image, button and text link individually.
Identify High-, Medium- and Low-Engagement Areas
CRMx can visually classify email sections based on customer engagement.
This allows teams to identify:
High-performing areas that should be repeated
Medium-performing areas that may need testing
Low-performing areas that may need to be moved, redesigned or removed
For example, a product block near the bottom of an email may generate very few clicks.
The marketing team can then decide whether to:
Move the product higher
Change the image
Rewrite the CTA
Reduce the amount of content above it
Replace the product with a more relevant recommendation
Remove the block completely
Heatmaps help campaign teams make these decisions based on customer behaviour rather than internal opinion.
Analyse Total and Unique Clicks
CRMx can help teams review both total and unique interactions.
Total clicks include repeated activity, while unique clicks help indicate how many individual subscribers engaged.
Comparing these metrics can reveal different patterns.
A CTA with many total clicks but relatively few unique clicks may have been selected several times by a smaller group.
A CTA with strong unique-click activity may indicate broader interest across the audience.
Combining these metrics with the visual heatmap helps teams understand both the volume and distribution of engagement.
Understand Which Element Was Clicked First
The first link selected by a subscriber can reveal which part of the email attracted attention most quickly.
CRMx click-order reporting can help teams analyse:
The first CTA selected
The second and later interactions
Whether subscribers followed the intended content journey
Whether navigation distracted from the primary action
Whether a product image attracted attention before the main CTA
For example, if most subscribers click a navigation link before the primary campaign button, the email may not have a strong enough conversion hierarchy.
If customers consistently click a hero image first, the visual creative may be more effective than the button or supporting copy.
Click-order insight helps teams optimise the sequence and structure of future emails.
Measure Time to Click
CRMx can also provide time-to-click insight.
This shows how quickly subscribers interacted after receiving the email.
Fast clicks may indicate:
Strong intent
Immediate relevance
Effective urgency
High product interest
Clear CTA placement
Slower clicks may indicate that subscribers returned to the email later or required more consideration before acting.
Time-to-click reporting can be valuable for:
Limited-time promotions
Product launches
Event registrations
Abandoned basket journeys
Appointment reminders
B2B lead-generation campaigns
This information can also influence follow-up timing and retargeting decisions.
Compare Dynamic and Personalised Email Variations
Salesforce Marketing Cloud is frequently used to deliver dynamic and personalised content.
Different subscribers may see different:
Hero images
Products
Headlines
Offers
Languages
CTA labels
CTA destinations
Content blocks
A single aggregated report may hide how each variation performed.
CRMx can help teams analyse dynamic variations separately.
Depending on the campaign setup, marketers can compare engagement by:
Country
City
Language
Customer segment
Dynamic variation ID
Dynamic title
Dynamic image
Dynamic CTA
Product affinity
This is particularly valuable for enterprise teams running campaigns across multiple regions, brands and audience groups.
Instead of assuming every personalised version performs equally, teams can see which variation generated the strongest engagement.
Compare Campaign Versions and A/B Tests
A/B testing usually identifies which version achieved the best overall result.
CRMx heatmaps help explain why.
Teams can compare how customers responded to different:
Hero images
CTA wording
Button positions
Product arrangements
Email lengths
Navigation structures
Dynamic variations
Promotional messages
For example, Version B may achieve a higher click-through rate because the main CTA was positioned higher.
Another version may perform better because customers engaged strongly with one specific product image.
Heatmaps provide the visual evidence behind the test result.
Extend Insight into View in Browser Activity
Some customers leave the inbox by selecting the View in Browser link.
The click on that link may be recorded in the email report, but customer behaviour can continue after the browser-rendered version opens.
CRMx View in Browser capabilities can provide additional insight into supported browser interactions such as:
Browser-page clicks
CTA interactions
Scroll behaviour
Mouse movement
Device information
Platform information
Session activity
This creates a more connected view of the customer journey from:
Email → View in Browser → Website
It also helps teams understand what happens after the subscriber leaves the original email.
Make Reporting Easier for Stakeholders
Campaign reporting is often shared with people who do not work directly inside Salesforce Marketing Cloud.
These may include:
CRM managers
Email designers
Marketing leaders
Regional teams
Agencies
Product managers
Senior executives
A list of URLs and click totals can be difficult to interpret.
A visual heatmap makes the results easier to understand.
Stakeholders can quickly see:
Which CTA performed best
Which areas attracted attention
Which products generated interest
Which sections were ignored
Where the conversion journey could be improved
This reduces the time required to explain campaign results and supports faster decision-making.
Turn Every Campaign into a Learning Opportunity
CRMx helps teams move from basic reporting to continuous optimisation.
After each campaign, marketers can record:
The most-clicked CTA
The strongest content block
The first element clicked
The average time to click
The best dynamic variation
The lowest-performing section
The main distraction from the conversion goal
One improvement for the next campaign
Over time, these findings create a library of customer behaviour insights.
Teams can use this knowledge to improve email templates, CTA placement, personalisation, product order and journey strategy.
Why Salesforce Marketing Cloud Teams Use CRMx
CRMx is designed to help Salesforce Marketing Cloud teams understand customer engagement visually.
CRMx Email Heatmaps can help teams:
Display clicks over the original email creative
Compare buttons, images and text links
Identify high-, medium- and low-engagement areas
Analyse total and unique clicks
Review click order
Measure time-to-click behaviour
Compare dynamic and personalised versions
Analyse supported View in Browser activity
Share visual reports with stakeholders
Improve campaign performance using behavioural evidence
Salesforce Marketing Cloud provides the campaign and click data.
CRMx turns that data into visual, actionable email intelligence.
See What Customers Actually Click
A click report shows that an interaction happened.
A CRMx email heatmap helps show where it happened, which creative element attracted attention and what the marketing team should improve next.
For teams that want to move beyond campaign totals and understand customer behaviour inside the email, CRMx provides the missing visual layer.
Explore the CRMx Email Heatmap features and benefits.
Ready to see how CRMx adds visual heatmap intelligence to your Salesforce Marketing Cloud emails?
Request a personalised CRMx demonstration and discover what your existing click reports are not showing.