In 2025, inbox competition is fiercer than ever. Your subscribers are bombarded with marketing messages daily, and standing out requires more than catchy subject lines and pretty templates.
If you’re using Salesforce Marketing Cloud (SFMC), you already have access to powerful reporting — but if you’re still relying only on opens and click-through rates, you’re missing the bigger picture.
That’s where visual email engagement mapping comes in. With tools like CRMx heatmaps, you can see exactly how subscribers interact with your emails and make confident, data-driven improvements.
🔍 What Is Visual Email Engagement Mapping?
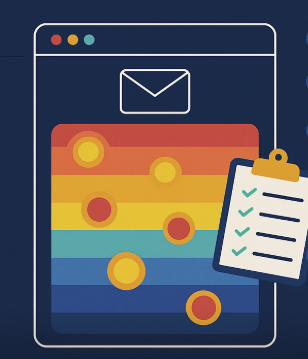
Visual email engagement mapping overlays click behavior data directly on top of your email design. Instead of a plain list of URLs and click counts, you see color-coded hotspots:
🔴 Hot zones = high engagement
🟡 Medium engagement areas
🔵 Cold zones with little or no interaction
This visual context lets you quickly identify which parts of your email are winning attention — and which are getting ignored.
📊 Why It Matters More Than Ever in 2025
With privacy changes, tracking limitations, and evolving customer expectations, engagement quality is becoming more important than quantity.
1. Opens Aren’t the Full Story
Apple’s Mail Privacy Protection and similar updates mean open rates can be misleading. Click and engagement mapping provides true behavioral insights.
2. Attention Is Shorter
Subscribers scan, skim, and decide in seconds. Mapping shows you if your most important content is actually being seen and clicked.
3. Mobile-First Behavior
With more than half of emails opened on mobile, you need to know if CTAs are thumb-friendly and visible without excessive scrolling.
4. Competitive Advantage
Many marketers still rely only on traditional reports. Adding visual mapping to your workflow gives you an edge in optimization speed and accuracy.
🚀 How CRMx Brings Engagement Mapping to SFMC
CRMx is purpose-built to deliver email heatmaps and engagement mapping for Salesforce Marketing Cloud. Here’s what you get:
🔥 Real-time click heatmaps for every send
📊 Click percentage rankings for every clickable element
📱 Mobile vs. desktop interaction views
🧪 Side-by-side A/B test comparisons
💼 Shareable, presentation-ready visual reports
CRMx integrates directly with SFMC using email job IDs, so all your engagement data flows in automatically — no extra tagging or setup.
🎯 How to Use Engagement Mapping for Better Results
Audit Your Layout – See if key CTAs are in hot zones and move them if not.
Link Every Clickable Element – If subscribers are clicking images or headlines, make sure they go somewhere.
Optimize Mobile Experience – Use CRMx’s mobile-specific mapping to ensure thumb-friendly design.
Test and Compare – Run A/B tests and compare engagement maps to see exactly what changes improve results.
Personalize by Behavior – Segment based on click patterns for smarter follow-up campaigns.
✅ Final Thoughts
Visual email engagement mapping takes the guesswork out of email optimization. Instead of relying on assumptions, you get clear visual proof of what’s working and what’s not.
In 2025 and beyond, CRMx + SFMC gives marketers the ability to:
See engagement patterns instantly
Improve designs based on real behavior
Continuously increase CTR and conversions
📬 Don’t just measure clicks — map them, understand them, and act on them.


