
Salesforce Marketing Cloud (SFMC) gives you a wealth of data — clicks, opens, conversions, and more. But here’s the truth:
Raw numbers don’t always tell you what’s really happening inside your emails.
To truly understand performance and drive better outcomes, you need more than just metrics — you need visual context.
That’s where email heatmap analytics for SFMC come in.
In this post, you’ll discover how using CRMx’s heatmap analytics with SFMC can help you transform basic click data into clear, actionable campaign wins.
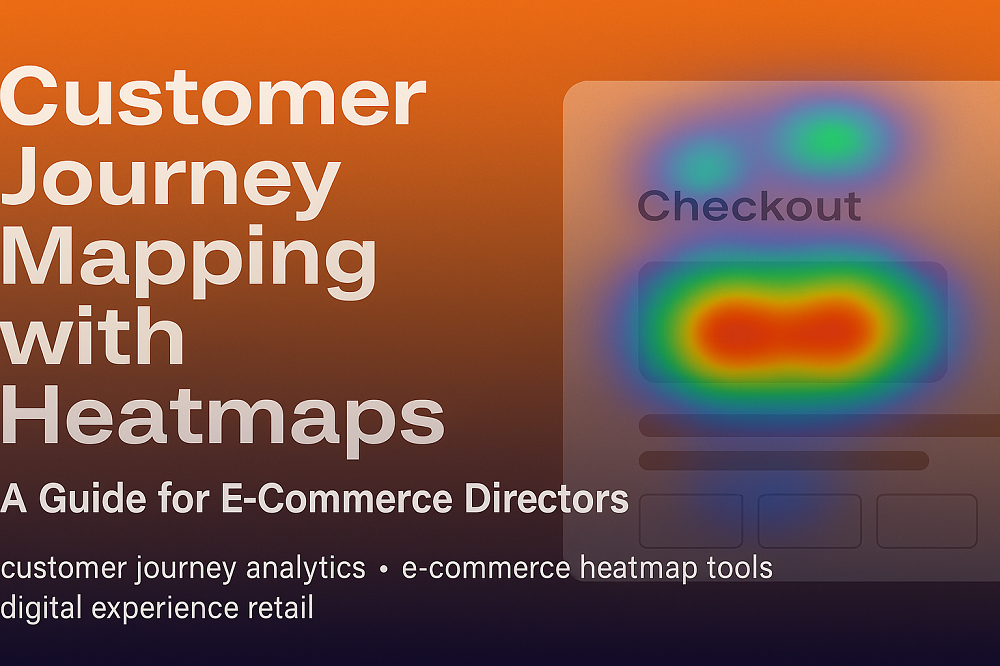
🔍 What Are Email Heatmap Analytics?
An email heatmap is a color-coded visual report that shows where subscribers clicked in your email. Instead of just telling you that 142 people clicked, heatmaps reveal:
Which CTA they clicked
Which section of the email drew the most attention
What content was ignored entirely
Color gradients help you visualize engagement:
🔴 Red = Most clicked
🟡 Yellow = Moderately clicked
🔵 Blue/Grey = Rarely or never clicked
🧠 Why Standard SFMC Click Data Isn’t Enough
With SFMC’s built-in reports, you can track:
Total and unique clicks
CTR
Link performance by URL
Email opens and unsubscribes
But you can’t see:
How click activity varies by section
If CTAs are buried in low-attention zones
If subscribers click unlinked elements like images or headings
Mobile vs. desktop click behavior
Heatmap analytics answer these questions visually, giving you deeper insight for smarter campaign decisions.
🚀 Turn Click Data Into Campaign Wins with CRMx
CRMx is the only dedicated email heatmap solution designed for Salesforce Marketing Cloud. It converts click data into visual insights so you can quickly identify what’s working — and what’s not.
Here’s how CRMx helps you unlock campaign success:
✅ 1. Visualize CTA Performance and Placement
Heatmaps help you answer:
Did your main CTA get clicked?
Was it placed in a high-engagement zone?
Are other elements stealing attention?
📈 Optimize CTA design, placement, and frequency for higher conversion rates.
✅ 2. Improve Layout and Content Flow
With CRMx heatmaps, you can see:
Where readers stop scrolling
Which product sections perform better
What parts of your email layout are being ignored
📐 Result: Smarter layouts that guide users toward conversion — not confusion.
✅ 3. Rescue Underperforming Emails with Fast Fixes
See cold spots and dead zones? You’ve found friction points.
Move or simplify underperforming sections
Remove distracting elements
Highlight the real value in the most visible areas
🛠 Make data-driven fixes without overhauling the whole campaign.
✅ 4. A/B Test with Visual Proof
Click numbers alone don’t explain why version A beat version B. Heatmaps show:
The CTA that worked
The product block that failed
How design and layout impacted engagement
🧪 Validate test results visually for faster learning and iteration.
✅ 5. Gain Insights Per Segment, Device, or Region
CRMx lets you filter heatmap views by:
Device (mobile vs. desktop)
Audience segment
Campaign type or region
🎯 Personalize future campaigns based on what each audience actually engages with.
💼 Designed for CRM Teams, Analysts, and Campaign Managers
CRMx is more than a visual tool — it’s a decision-making engine.
Whether you're part of the CRM, lifecycle, or performance team, CRMx lets you:
Report campaign results with visual clarity
Identify drop-off points and engagement patterns
Justify design changes with hard (visual) data
Improve ROI with every send
🔧 How CRMx Works with SFMC
No code setup — CRMx integrates directly with your Salesforce Marketing Cloud instance
Email job IDs are automatically tracked
Heatmaps are generated per campaign and can be viewed in the CRMx dashboard
Visual overlays can be downloaded or shared with your team
🔗 Learn more at crmx.uk
✅ Final Thoughts
Click reports show you the numbers.
Heatmap analytics show you the story.
If you’re using SFMC, CRMx gives you the power to turn data into results — faster, smarter, and with full visual clarity.
📬 Don’t just track clicks — map them, learn from them, and win more campaigns.