
Clicks are more than just numbers in a report — they’re digital fingerprints of your customers’ interests, preferences, and intent.
If you’re using Salesforce Marketing Cloud (SFMC), you already have access to rich click data. But without visual context, those numbers can be hard to interpret and even harder to act on.
That’s where CRMx heatmaps step in. They turn raw SFMC click data into clear, visual insights so you can understand customer behavior at a glance and make smarter campaign decisions.
In this guide, you’ll learn how to analyze customer clicks in SFMC using CRMx heatmaps to improve engagement, conversions, and ROI.
🔍 Why Visual Click Analysis Beats Raw Data
Traditional SFMC click reports tell you:
How many clicks an email got
Which URLs were clicked
Click-through rate (CTR)
But they don’t tell you:
Which section of your email drove the most clicks
If your CTAs are in high-visibility zones
Whether users are clicking images, buttons, or text
How behavior differs between mobile and desktop audiences
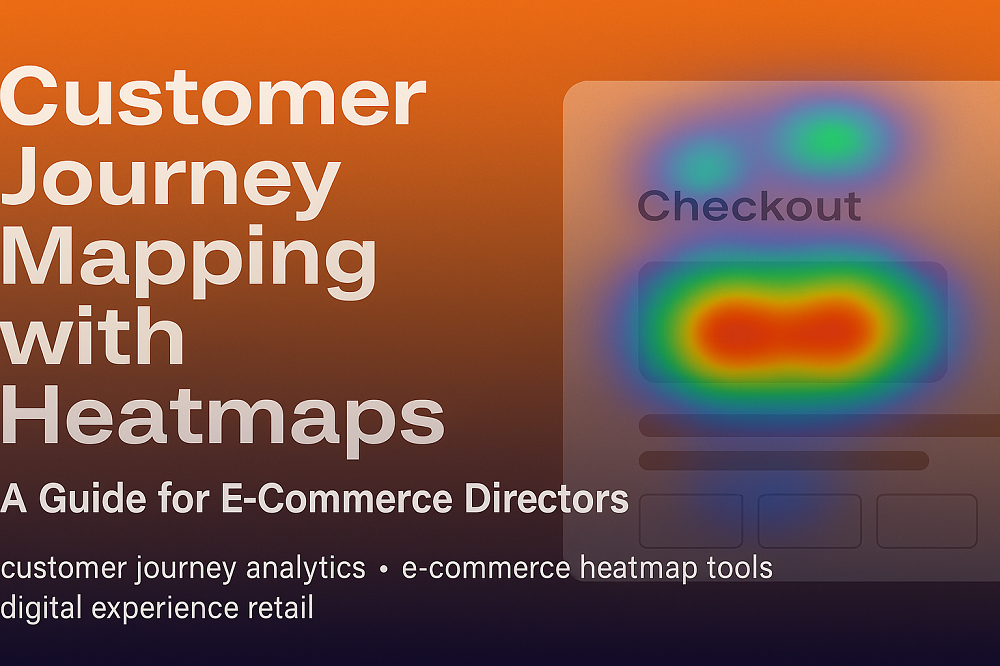
CRMx heatmaps solve this problem by overlaying your email design with color-coded click data:
🔴 Hot zones = high engagement
🟡 Warm zones = moderate clicks
🔵 Cold zones = low or no interaction
🛠 Step-by-Step: How to Analyze Customer Clicks in SFMC with CRMx
1. Connect CRMx to Your SFMC Instance
CRMx integrates seamlessly with Salesforce Marketing Cloud by using Email Job IDs.
Once connected, CRMx automatically collects click data for each send — no extra coding or manual setup required.
2. Send Your Email Campaign
You send your email from SFMC as usual. CRMx listens in the background, capturing:
Click location
Click order and frequency
Device type (mobile vs. desktop)
Time of click
3. Access Heatmaps in the CRMx Dashboard
After the send, log in to CRMx to view your interactive heatmap. You’ll see:
Where customers clicked
Click intensity across different sections
Percentage breakdown of clicks per element
4. Identify High- and Low-Performing Elements
Ask yourself:
Are customers clicking the main CTA or getting distracted by secondary links?
Are product images driving engagement?
Is footer content ever clicked?
📊 CRMx highlights both hotspots (opportunities to expand) and cold zones (areas to fix or remove).
5. Segment Insights for Targeted Actions
CRMx lets you filter heatmaps by:
Audience segment
Campaign type
Device type
💡 This is gold for CRM teams who want to personalize future sends based on click patterns.
6. Optimize and Test Again
Using your heatmap findings, you can:
Move CTAs to higher engagement zones
Link unlinked image areas
Remove underperforming blocks
A/B test new designs and compare heatmap visuals to confirm improvements
🎯 Example Insights You Can Uncover with CRMx
Mobile users click the product carousel far less than desktop users — solution: redesign for thumb-friendly tapping.
Customers click the promo image more than the “Shop Now” button — solution: make the image clickable or adjust CTA styling.
Footer menu links receive zero clicks — solution: remove or replace with a stronger closing CTA.
🚀 Why CRMx Is Built for This
CRMx is the only dedicated email heatmap and click analytics platform built for Salesforce Marketing Cloud. It gives you:
🔥 Real-time visual click tracking
🧪 A/B test overlays for design validation
📊 Ranked CTA performance and click percentages
📱 Device-specific engagement views
💼 Easy-to-share visual reports for stakeholders
✅ Final Thoughts
Analyzing customer clicks in SFMC is no longer just about numbers in a spreadsheet.
With CRMx heatmaps, you can:
See exactly how subscribers interact with your emails
Turn insights into targeted actions
Continuously improve engagement and conversions
📬 Stop guessing what’s working. Start seeing it.