
Introduction
In digital marketing, every click matters. But traditional reports only show numbers. They don’t reveal where customers engage or why they drop off. That’s where heatmap analytics comes in — the secret weapon for higher conversions in 2025.
🔥 What Is Heatmap Analytics?
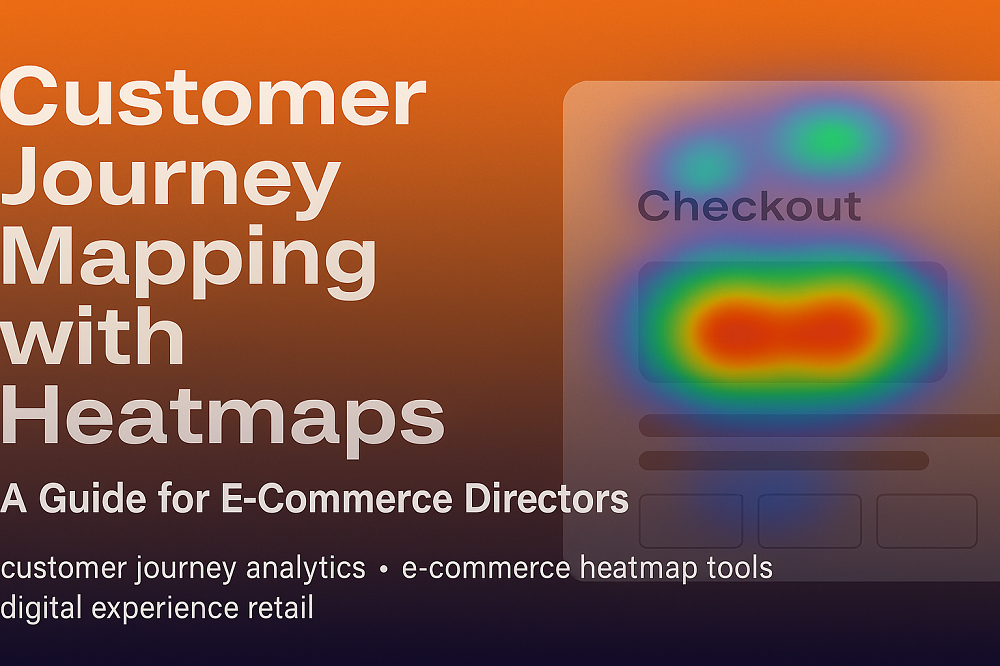
Heatmap analytics transforms raw interaction data into visual maps. Hot colors (red/orange) show areas of high engagement. Cold colors (blue/grey) reveal ignored sections. This makes it easy to see how users interact with your emails, landing pages, or product flows.
- Click heatmaps – where users tap or click
- Scroll heatmaps – how far users scroll
- Move heatmaps – cursor or gesture movement patterns
🛍️ Why It Matters for Marketers
Without heatmaps, optimization is guesswork. With them, you know:
- Which CTAs work best
- Which products grab attention
- Where drop-offs happen
For example, retailers unlock hidden revenue (read here), while SaaS leaders use them to convert trials to paid (see example).
📊 How Heatmaps Improve Conversions
Here’s how top teams use heatmap analytics:
- Highlight winning CTAs – move buttons where users click most
- Eliminate dead zones – cut clutter that distracts
- Guide user journeys – reorder sections based on real behavior
- Test faster – validate A/B designs visually
🎥 Heatmaps + Session Recordings
Heatmaps show the “where.” Session recordings show the “why.” Together, they provide a complete picture of user behavior and friction points. (compare here)
🚀 Why CRMx
CRMx was built for Salesforce Marketing Cloud and modern marketers. It combines heatmaps, session recordings, and smart reporting into one platform. That means less guesswork, faster optimization, and more revenue.
Explore related resources: Future of CRO | Journey Mapping
✅ Final Thoughts
In 2025, heatmap analytics is no longer optional. It’s the foundation of smarter campaigns, optimized landing pages, and higher conversions.
📩 Ready to see your clicks in action?
🚀 Request a CRMx Demo