CRM teams live and breathe customer data. Whether you’re building lifecycle journeys, segmenting audiences, or optimizing retention campaigns, your success depends on understanding how customers behave — especially within the inbox.
But traditional email metrics like open rates and CTR only tell part of the story.
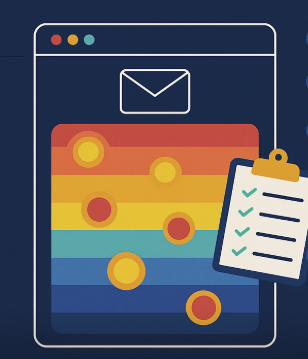
To truly understand how customers interact with your emails, you need to go beyond the numbers. You need email heatmaps — a visual tool that shows what gets clicked, what gets ignored, and what drives action.
In this blog, we’ll explore why engagement mapping with heatmaps is an essential strategy for CRM teams, and how it leads to smarter segmentation, better targeting, and more impactful customer communication.
📍 What Is Engagement Mapping?
Engagement mapping is the process of visualizing how subscribers interact with your email content. Using heatmaps, CRM teams can track:
Click locations (buttons, text links, images)
Scroll behavior and attention depth
Hotspots vs. cold zones
Device-specific engagement (mobile vs. desktop)
It goes far beyond CTR — it shows how and where people engage.
✅ Why CRM Teams Need Heatmaps
1. 🎯 Better Targeting Through Behavior-Based Segmentation
Knowing that a user clicked is helpful.
Knowing what they clicked is powerful.
With heatmaps, CRM teams can segment based on engagement zones:
Clicked product blocks vs. ignored them
Engaged with top navigation vs. skipped entirely
Showed interest in promotions vs. editorial content
📊 Create behavioral segments that fuel smarter retargeting, dynamic content, and personalized journeys.
2. 📐 Optimize Email Layouts for Lifecycle Campaigns
Welcome journeys, re-engagement programs, loyalty emails — they all depend on strategic content flow.
Heatmaps help CRM teams:
See if CTAs are placed in attention zones
Discover which elements support (or distract from) core goals
Identify patterns across lifecycle stages
📈 Result: More efficient campaign design and higher email ROI.
3. 🧠 Understand What Different Customer Types Engage With
Not all customers engage the same way. Heatmaps help you compare:
VIPs vs. new customers
Engaged vs. lapsed audiences
UK vs. US or mobile vs. desktop behaviors
💡 Use this insight to tailor messaging and design for each group.
4. 🛠 Improve Triggered and Automated Journeys
Heatmaps show how customers interact with transactional and triggered emails, such as:
Order confirmations
Wishlist reminders
Abandoned cart emails
With that data, CRM teams can:
Reorder product blocks for better engagement
Test CTA placement and frequency
Identify friction points in purchase paths
🚀 This turns automated flows into revenue-generating engines.
5. 🧪 Support Data-Backed A/B Testing
CRM teams often manage testing strategies across geos, segments, or touchpoints. Heatmaps help validate:
Which version drives better engagement — and why
How CTA design or tone affects clicks
What content structure gets more attention
🔁 Iterate with clarity, not assumptions.
🛠 Empower CRM Teams with CRMx
To unlock the full power of engagement mapping, CRM teams need a tool built for their ecosystem — and that’s where CRMx comes in.
Why CRMx?
🔥 Click heatmaps for every Salesforce Marketing Cloud email
🧪 A/B test overlays for performance comparison
📊 Click zones, engagement depth, and device-specific insights
💼 Dashboards tailored for CRM analysts, campaign managers, and marketing leaders
With CRMx, CRM teams don’t just track engagement — they understand it.
💡 Final Thought
CRM teams are the heartbeat of personalized customer marketing. But to connect the dots between customer behavior and email performance, you need more than raw data — you need visual insights.
Email heatmaps transform guesswork into guidance and make your CRM strategy smarter, faster, and more effective.
📬 Make engagement mapping your CRM team's competitive advantage — with CRMx.


