

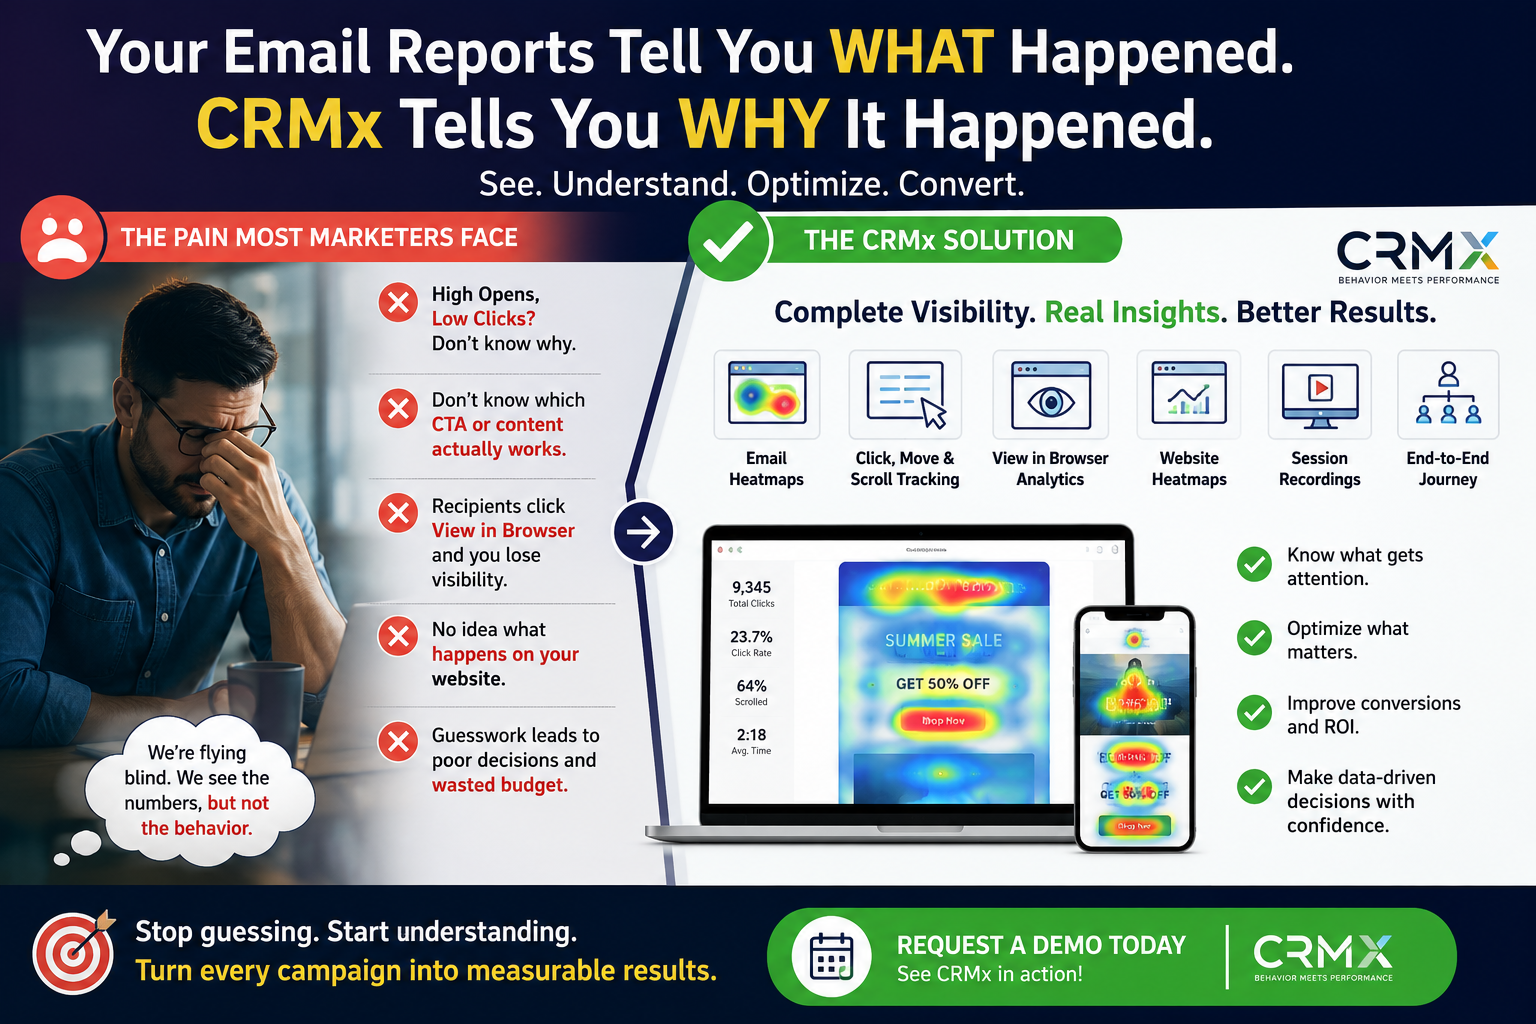

Why Salesforce Marketing Cloud Reporting Is Not Enough: The Missing Insights That Increase Email Conversions
Salesforce Marketing Cloud gives marketers valuable campaign metrics, including email opens, clicks, click-through rates, bounces, unsubscribes and journey performance.
However, these reports only explain what happened.
They do not always explain:
- Why one call-to-action performed better than another
- Which content blocks were ignored
- Whether recipients reached the bottom of the email
- How different personalised versions performed
- What happened after someone clicked View in Browser
- How users continued from the email to a landing page or website
To improve email performance, marketing teams need more than campaign reporting. They need visual behavioural intelligence.
The Limitations of Traditional Salesforce Marketing Cloud Reporting
Salesforce Marketing Cloud reporting helps teams monitor important campaign metrics such as:
- Emails sent
- Emails delivered
- Unique opens
- Unique clicks
- Click-through rate
- Click-to-open rate
- Bounce rate
- Unsubscribe rate
- Journey performance
- Device and browser information
These metrics are essential, but they do not provide a complete picture of how recipients interact with the email design.
For example, an email may generate 2,000 clicks, but the standard report may not clearly show:
- Which section attracted the most attention
- Whether the main CTA was positioned correctly
- Which images influenced engagement
- Whether recipients scrolled far enough to see the final offer
- Which personalised variation performed best
- Whether mobile and desktop users behaved differently
Without these insights, optimisation decisions can become based on assumptions rather than real customer behaviour.
What Are Email Heatmaps?
Email heatmaps visually display where recipients click within an email.
Instead of reviewing clicks only in a table, marketers can see engagement directly over the email creative.
This helps teams quickly identify:
- The most-clicked CTAs
- High-performing images
- Popular text links
- Content blocks receiving limited engagement
- Sections that may need repositioning
- Differences between desktop and mobile behaviour
Email heatmaps make campaign reports easier to understand and easier to share with stakeholders.
Why Click Numbers Alone Can Be Misleading
Two CTAs may receive a similar number of clicks but perform very differently.
For example, a CTA at the top of an email may receive more clicks because nearly every recipient sees it. A CTA near the bottom may receive fewer clicks but perform strongly among recipients who scroll far enough to reach it.
Looking only at total clicks may lead a marketing team to remove or replace the lower CTA.
A visual heatmap provides context by showing where the CTA appears, how surrounding content performs and how engagement is distributed across the full email.
Understand Which Email Content Drives Engagement
A typical marketing email may contain:
- A hero banner
- Product imagery
- Promotional messaging
- Personalised content
- Category links
- Multiple CTA buttons
- Social media links
- Footer navigation
Traditional reports often separate the performance data from the email design.
CRMx brings the data and creative together, helping marketers understand which content blocks generate engagement and which areas are being overlooked.
This allows teams to make informed decisions about:
- CTA placement
- Email length
- Content hierarchy
- Image selection
- Product positioning
- Link prominence
- Mobile layout
- Personalisation strategy
Analyse Dynamic and Personalised Email Versions Separately
Salesforce Marketing Cloud allows marketers to create dynamic emails based on customer attributes such as:
- Country
- City
- Preferred store
- Customer segment
- Product interest
- Loyalty status
- Language
- Purchase history
- Engagement behaviour
However, when multiple content variations are used within the same campaign, understanding the performance of each version can become difficult.
CRMx can provide separate analysis for dynamic and personalised email versions instead of combining all engagement into one overall report.
Marketing teams can compare:
- Version A against Version B
- Multiple dynamic versions from A to J
- Country-specific content
- City-specific offers
- Language variations
- Customer segment variations
- Different CTA names, destinations and content blocks
This makes it easier to identify which personalised experiences generate the strongest engagement.
Improve A/B Testing with Visual Comparisons
Traditional A/B testing commonly compares:
- Subject lines
- Preheaders
- Sender names
- Email designs
- CTA wording
- Promotional offers
- Images
- Content order
Standard reports may show which version generated the highest click-through rate, but they do not always explain why that version performed better.
Email heatmap comparison helps teams visually compare each version side by side.
This can reveal:
- Whether a CTA received more attention because of its position
- Whether one image attracted more clicks
- Whether a shorter layout improved engagement
- Whether recipients ignored secondary content
- Whether engagement was concentrated around one promotional message
Visual comparison makes A/B test results more actionable.
Track View in Browser Engagement
Some recipients click the View in Browser link when:
- Email images do not load correctly
- They prefer viewing the email in a browser
- The email layout is difficult to read in their inbox
- Their email client restricts certain content
Once recipients leave the inbox, traditional email reporting may provide limited visibility into their behaviour.
CRMx View in Browser analytics can help teams understand how users interact with supported browser-based email experiences.
This can include:
- Browser-page clicks
- Mouse movement
- Scroll behaviour
- Device information
- Browser information
- Location information
- Session recordings
- Engagement with browser-based email content
This provides a clearer understanding of the customer journey after the View in Browser link is selected.
Connect Email Engagement to Website Behaviour
An email click is often not the end of the journey.
After clicking, a recipient may:
1. Visit a landing page
2. Browse a product or service page
3. Review supporting information
4. Scroll through the page
5. Click another CTA
6. Start a form
7. Leave before converting
8. Return later using another device
When email and website reports are analysed separately, teams may struggle to understand the full journey.
CRMx helps connect behavioural intelligence across:
Email → View in Browser → CloudPage or landing page → Website → Session recording
This allows marketing teams to investigate where engagement increases, where customers hesitate and where conversion opportunities may be lost.
Use Website Heatmaps to Identify Conversion Barriers
Website heatmaps help marketers understand what visitors do after leaving the email.
Depending on the implementation, teams can analyse:
- Click activity
- Scroll depth
- Mouse movement
- CTA interaction
- Mobile and desktop behaviour
- Landing-page engagement
- Form interaction
- Navigation patterns
These insights can highlight problems such as:
- Important CTAs positioned too far down the page
- Visitors clicking non-clickable elements
- Forms receiving limited attention
- Promotional content distracting users
- Mobile layouts hiding key information
- Users abandoning pages before reaching conversion points
Use Session Recordings to Understand the Full Experience
Heatmaps reveal patterns across groups of visitors.
Session recordings provide additional context by showing individual website or View in Browser interactions.
Marketing, CRM and optimisation teams may use session recordings to investigate:
- Hesitation before clicking
- Repeated or frustrated clicks
- Unexpected scrolling behaviour
- Confusing page layouts
- Form abandonment
- Navigation problems
- Differences between mobile and desktop experiences
This helps teams move beyond assumptions and see how real users interact with campaign experiences.
How CRMx Extends Salesforce Marketing Cloud Reporting
CRMx is designed to complement Salesforce Marketing Cloud reporting rather than replace it.
Salesforce Marketing Cloud continues to provide the core campaign metrics, while CRMx adds visual and behavioural intelligence.
CRMx capabilities include:
- Salesforce Marketing Cloud email heatmaps
- CTA and link performance analysis
- Dynamic-content heatmaps
- Personalised-version reporting
- Email A/B and multivariate comparisons
- View in Browser analytics
- Website and CloudPage heatmaps
- Click, move and scroll tracking
- Session recordings
- Device and location reporting
- End-to-end customer journey intelligence
Together, these capabilities help teams understand not only what happened, but also where users engaged and what should be improved.
Business Problems CRMx Can Help Solve
CRMx can help marketing teams answer practical questions such as:
- Why are email opens high but clicks low?
- Why is the primary CTA underperforming?
- Which content should move higher in the email?
- Which personalised version generates the strongest engagement?
- Are recipients reaching important content near the bottom?
- How do mobile and desktop users behave differently?
- What happens after someone clicks View in Browser?
- Where do visitors drop out after reaching the website?
- Which A/B test version has the strongest layout?
- Which content blocks should be removed or redesigned?
These questions are difficult to answer using campaign totals alone.
Benefits for CRM and Marketing Teams
Behavioural intelligence can help organisations:
- Reduce guesswork
- Improve CTA placement
- Increase email engagement
- Optimise dynamic content
- Strengthen A/B testing
- Improve landing-page performance
- Identify customer journey friction
- Produce clearer stakeholder reports
- Prioritise changes using behavioural evidence
- Learn more from every campaign
It also helps CRM, campaign, design, development and analytics teams work from a shared visual view of performance.
Traditional Reporting Tells You What Happened
Traditional campaign reporting remains important.
It tells teams how many emails were delivered, opened, clicked or unsubscribed.
However, behavioural analytics adds another level of understanding.
Traditional reporting tells you:
- What happened
- How many users engaged
- Which campaign achieved the highest metrics
Behavioural intelligence helps explain:
- Where engagement occurred
- Which content influenced behaviour
- What users may have ignored
- How different versions performed
- Where optimisation opportunities exist
Using both approaches provides a more complete view of campaign performance.
Final Thoughts
Salesforce Marketing Cloud reporting gives marketers essential campaign data, but numbers alone may not explain why customers behave in a particular way.
Email heatmaps, dynamic-version reporting, View in Browser analytics, website heatmaps and session recordings provide the visual context needed to make better optimisation decisions.
By connecting email engagement with the wider customer journey, CRMx helps marketing teams understand what recipients click, which content they ignore, how far they progress and where the experience can be improved.
Instead of relying on assumptions, teams can use real behavioural evidence to optimise emails, landing pages and customer journeys.
Ready to Understand How Customers Really Interact with Your Campaigns?
Discover how CRMx can help your team visualise email engagement, compare dynamic versions, track View in Browser behaviour and continue customer journey analysis across landing pages and websites.
"Request a personalised CRMx demo" (https://crmx.uk/request-demo)
"Explore CRMx features and benefits" (https://crmx.uk/features-benefits)